xarc
draw a part of an ellipse
Syntax
xarc(x,y,w,h,a1,a2)
Arguments
- x,y,w,h
four real values defining a rectangle.
- a1,a2
real values defining a sector.
Description
xarc draws a part of an ellipse contained in the rectangle
(x,y,w,h) (upper-left point, width, height), and in the sector
defined by
the angle alpha1 and the angle alpha1+alpha2.
alpha1 and alpha2 are
given respectively by a1/64 degrees and a2/64 degrees.
This function uses the current graphics color and user coordinates.
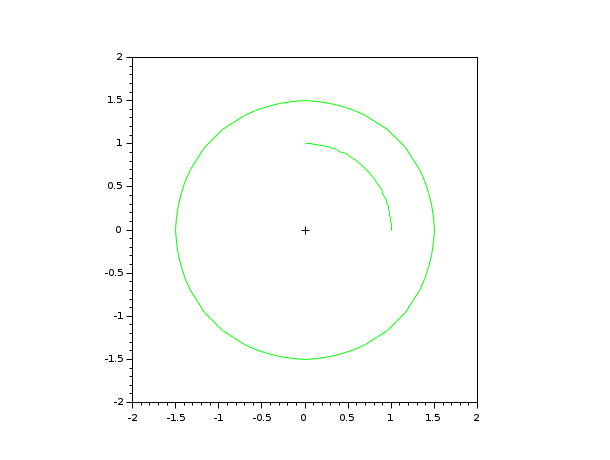
Examples
// isoview scaling
plot2d(0,0,-1,"031"," ",[-2,-2,2,2])
xarc(-1,1,2,2,0,90*64)
xarc(-1.5,1.5,3,3,0,360*64)
gca().children(1:2).foreground = color("green");
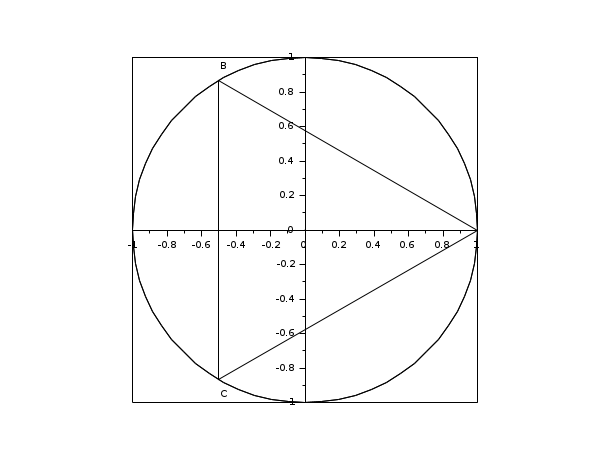
rect=[-1,-1,1,1]
plot2d(0,0,0,rect=rect,frameflag=3,axesflag=5)
xrpoly([0,0],3,1)
xarc(-1,1,2,2,0,64*360)
xarc(-1,1,2,2,0,64*360)
xstring(1,0.1,'A')//label A
xstring(-0.5,0.9,'B')//label B
xstring(-0.5,-1,'C')//label C
See also
| Report an issue | ||
| << Segments properties | geometric_shapes | xarcs >> |