contour2d
level curves of a surface on a 2D plot
Syntax
contour2d(x, y, z, nz, [style, strf, leg, rect, nax, fpf])
contour2d(x, y, z, nz, <opt_args>)
Arguments
- x, y
two real row vectors of size
n1andn2: the grid.- z
real matrix of size
(n1,n2), the values of the function on the grid or a Scilab function which defines the surfacez=f(x,y).- nz
the level values or the number of levels.
- If
nzis an integer its value gives the number of level curves equally spaced from
zmintozmaxas follows:z= zmin + (1:nz)*(zmax-zmin)/(nz+1)
 Note that the
zminandzmaxlevels are not drawn (generically they are reduced to points) but they can be added with- If
nzis a vector nz(i)gives the value of thei-th level curve.
- If
- <opt_args>
This represents a sequence of statements
key1=value1,
                key2=value2
,... wherekey1,key2,... can be one of the following:style,leg,rect,nax,strforaxesflagandframeflag(see plot2d)- style, strf, leg, rect, nax
see plot2d. The argument
stylegives the dash styles or colors which are to be used for level curves. It must have the same size as the number of levels.- fpf
You can change the format of the floating point number printed on the levels where
fpfis the format in C format syntax (for examplefpf="%.3f"). Setfpfto " " implies that the level are not drawn on the level curves. If not given, the default format is"%.3g".
Description
contour2d draws level curves of a surface
z=f(x,y) on a 2D plot. The values of
f(x,y) are given by the matrix
z at the grid points defined by
x and y.
The optional arguments style,
strf, leg,
rect, nax can be
passed by a sequence of statements key1=value1,
key2=value2
,... where keys may be
style, strf,
leg, rect,
nax. In this case, the order has no special meaning.
Use contour to draw levels curves on a 3D surface.
Examples
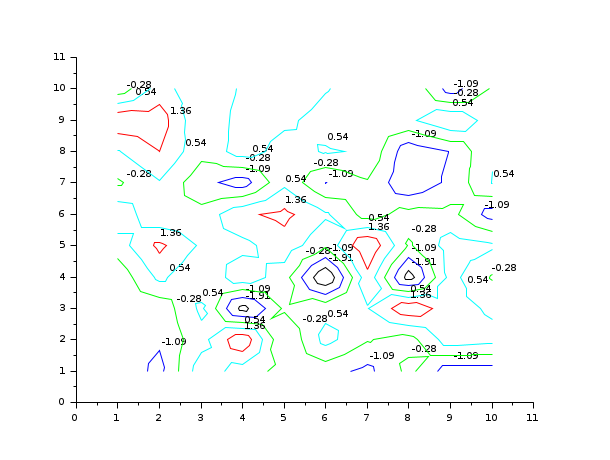
contour2d(1:10,1:10,rand(10,10),5,rect=[0,0,11,11])
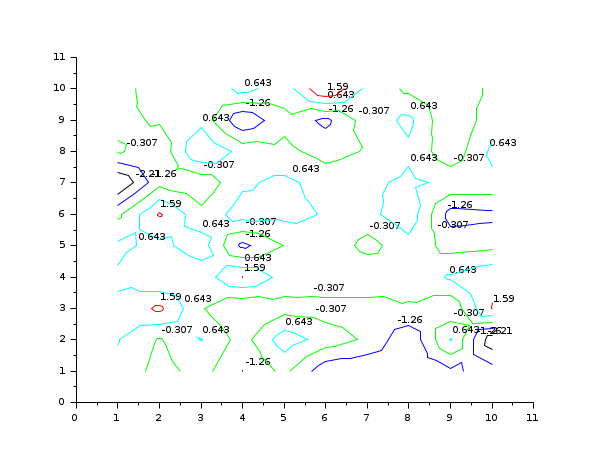
clf()
// changing the format of the printing of the levels
contour2d(1:10,1:10,rand(10,10),5,rect=[0,0,11,11],fpf="%.2f")
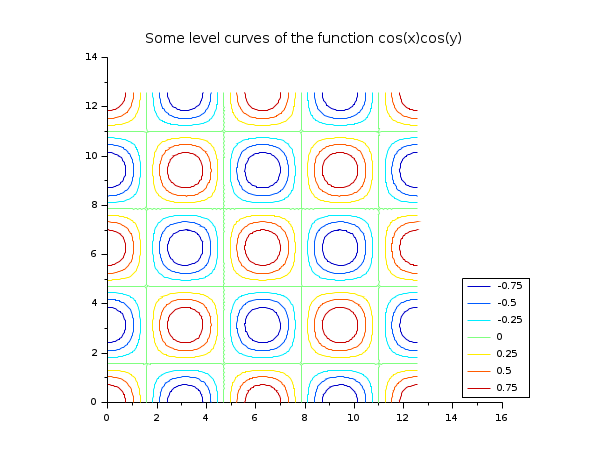
// now an example with level numbers drawn in a legend
// Caution there are a number of tricks...
x = linspace(0,4*%pi,80);
z = cos(x')*cos(x);
clf(); f=gcf();
// trick 1: fpf=" " implies that the level numbers are not
//          drawn on the level curves
f.color_map=jetcolormap(7);
// trick 2: to be able to put the legend on the right without
//          interfering with the level curves use rect with a xmax
//          value large enough
contour2d(x,x,z,-0.75:0.25:0.75,frameflag=3,rect=[0,0,5*%pi,4*%pi],fpf=" ")
// trick 3: use legends (note that the more practical legend function
//          will not work as soon as one of the level is formed by 2 curves)
legends(string(-0.75:0.25:0.75),1:7,"lr");
xtitle("Some level curves of the function cos(x)cos(y)")
See also
- contour — level curves on a 3D surface
- contour2di — compute level curves of a surface on a 2D plot
- contour2dm — compute level curves of a surface defined with a mesh
- plot2d — 2D plot
| Report an issue | ||
| << comet | 2d_plot | contour2di >> |