xlabel
sets or updates the x-axis label or/and its properties
ylabel
sets or updates the y-axis label or/and its properties
zlabel
sets or updates the z-axis label or/and its properties
Syntax
xlabel(label)
xlabel(label, property_name, property_value,...)
xlabel(property_name, property_value,...)
xlabel(axes_handle,...)

ylabel(label)
ylabel(label, property_name, property_value,...)
ylabel(property_name, property_value,...)
ylabel(axes_handle,...)

zlabel(label)
zlabel(label, property_name, property_value,...)
zlabel(property_name, property_value,...)
zlabel(axes_handle,...)
Arguments
- label
Matrix of texts of the label. A label can have multiple rows or/and columns of text. Leading and trailing blanks are trimmed. In their columns, texts are left-justified. LaTeX expressions delimited with "$...$" are supported.
- axes_handle
Handle of the axes whose x|y|z label must be set or updated. By default, the current axes is processed. Otherwise, the given axes is set as and remains the current one after returning from
x|y|zlabel().- property_name, property_value,...
unlimited series of pairs of property name (word) and the respective value to assign to it. The available properties are related to labels properties). Some of them have an alias that can be used as well with
x|y|zlabel():visible "on"or"off". If"off", the label (and its box) still exists but is not displayed.fontsize font_size Scalar positive number specifying the size of displayed characters. default = 1. For any non-integer size, the font is scaled accordingly and anti-aliased (made a bit foggy). fontname font_style Ten font names are available (case and space unsensitive string), or their related id number: 0 "courrier" 2 "times" 6 "helvetica" 1 "symbol" 3 "times italic" 7 "helvetica italic" 4 "times bold" 8 "helvetica bold" 5 "times bold italic" 9 "helvetica bold italic" For instance, 3, "3", "times italic", "timesitalic" or "TimesItalic" are equivalent.
Other fonts can be loaded with
xlfont()and used.color font_foreground Color of the text of the label (*). position Vector of coordinates of the label's anchor, in data unit. The anchor is the lower-left corner of the box of the label (when horizontal). Note: This property can't be set with a console-oriented syntax. rotation font_angle Direct (anti-clockwise) angle of the label's block, in degrees, horizontal = 0°. The lower-left corner of the box bounding the horizontal label is used as pivot (fixed point). box "off" | "on": hides or displays a box around the block of text of the label. edgecolor foreground Color of the border of the box (if any)(*). The box is then automatically turned "on". background backgroundcolor Filling color of the box background, behind the text (*). The box is then automatically turned "on". tag String or matrix of strings: Custom literal identifier of the label. (*) Any color can be specified by any of the following:
- Its numerical or literal index in the current colormap (like 13 or "13"). Special values whatever is the colormap: -1 for black, -2 for white.
- Its name as a string, if it is a predefined listed color. For colors among the short list ["red","green","blue","cyan","magenta","yellow","black","white"], shortened names are supported, like "m" for magenta or "k" for "black".
- Its "#RRGGBB" hexadecimal code, as a string.
- the [r,g,b] row of its Red/Green/Blue 0 ≤ r,g,b ≤ 1 intensities. This syntax can't be used in console-oriented mode.
Description
xlabel, ylabel, zlabel are used to label the x|y|z-axis, respectively, or to change properties of existing labels.
Each of these functions can be called with a functional syntax like
xlabel("My title", "fontsize", 3) or with an equivalent
console-oriented syntax like xlabel "My title" fontsize 3.
However, [r,g,b] row color and [x,y] coordinates specifications can't be used
in console-oriented syntaxes.
 | When an axes handle is specified as the target axes, it becomes the current axes
and remains as is after leaving x|y|zlabel(). |
Examples
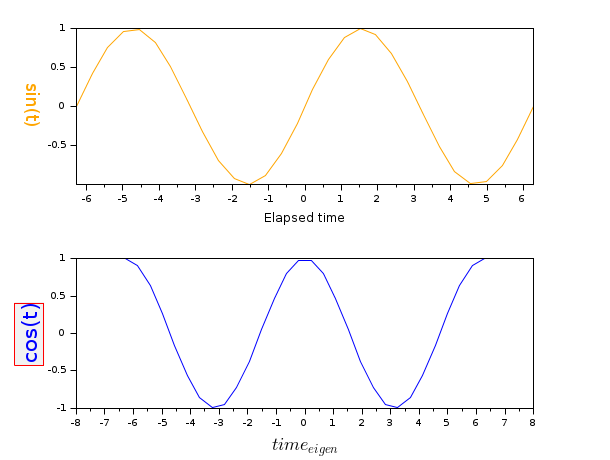
t = linspace(-2*%pi, 2*%pi, 30);
plot2d([], [], 0, "011", " ", [0 0 1 1])

subplot(2,1,1)
plot(t, sin(t), "color", "orange")
xlabel "Elapsed time" fontsize 2
ylabel sin(t)
ax1 = gca();

subplot(2,1,2)
plot(t, cos(t), "b")
xlabel $time_{eigen}$  fontsize 4
ylabel cos(t) fontsize 4.5 color blue
ylabel edgecolor r background grey95

ylabel(ax1, "fontsize", 4)
// Now ax1 is the current axes:
ylabel color orange  rotation -90
See also
- label_properties — Properties of Axes labels and title
- title — displays a title above a graphic axes, or updates its properties.
- xtitle — add titles on a graphics window
- Interactive editor — Interactive plot editor
- xstring — dessine des chaînes de caractères
- color_list — liste des noms de couleurs prédéfinies
- color — returns the color id of a color
- xlfont — load a font in the graphic context or query loaded font
- set — set properties of some graphic objects or uimenus or uicontrol interactive components
History
| Version | Description |
| 6.1.0 |
|
| Report an issue | ||
| << title | annotation | xtitle >> |