evans
Evans root locus
Syntax
evans(H)
evans(H, kmax)
Arguments
- H
SISO linear system given by a transfer or a state space representation (see:syslin).
- kmax
real number: maximum gain desired for the plot.
Description
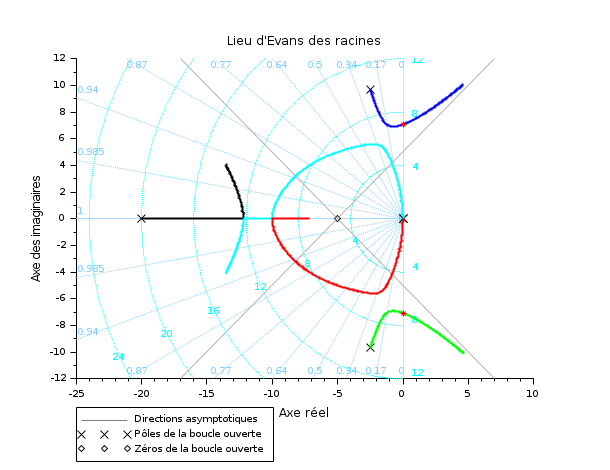
Gives the Evans root locus for a SISO linear system in state-space or
transfer form H(s) (syslin). This is
the locus of the roots of
1+k*H(s)=1+k*N(s)/D(s), in the complex
plane. For a selected sample of gains k <=
kmax
,the imaginary part of the roots of
D(s)+k*N(s) is plotted vs the real part.
To obtain the gain at a given point of the locus you can activate the datatips manager and click the desired point on the root locus.
Examples
H = syslin('c',352*poly(-5,'s')/poly([0,0,2000,200,25,1],'s','c'));
clf();
evans(H,100);
sgrid()

// Post-tuning graphical elements
ch = gca().children;
curves = ch(2).children;
curves.thickness = 2;
asymptotes = ch(ch.type=="Segs");
asymptotes.segs_color = color("grey70");

// Completing Evans plot:
[Ki,s] = kpure(H) // Gains that give pure imaginary closed loop poles
plot([real(s) real(s)],[imag(s) -imag(s)],'*r')

[Kr,s] = krac2(H)
See also
| Report an issue | ||
| << dtsi | Stabilité | g_margin >> |