datatipSetStyle
Set the datatip style.
Syntax
datatipSetStyle(polyline_handle)
datatipSetStyle(polyline_handle,t [,boxed [,labeled]])
Arguments
- polyline_handle
The handle of the polyline where the tip is.
- t
A number with possible value 1 or 2. If omitted a choose popup will open.
- boxed
A a boolean, default value is %t.
- labeled
A a boolean, default value is %t.
Description
There are two different styles for the datatip polyline marker:
- Square mark, centered on the tip point.
- Directional arrows drawn along the tangent at the tip point. The arrowhead is on the tip point.
If the boxed option is selected the text associated with the datatip is written in a boxed area.
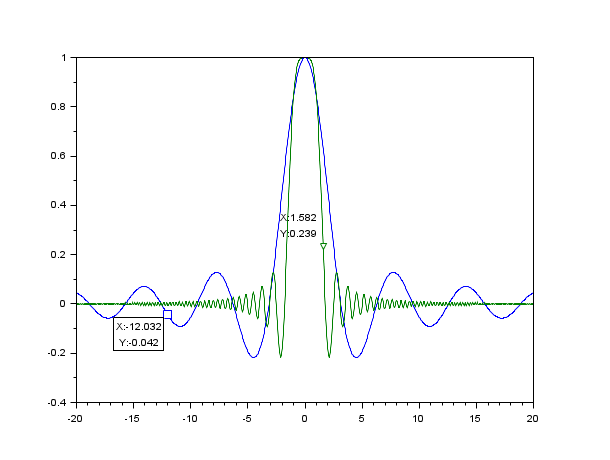
Examples
x=linspace(-20,20,1000);
clf();plot(x,sinc(x),x,sinc(x.^2));
e=gce();e=e.children;
d1=datatipCreate(e(1),540);
function str=mydisplay(h)
pt = h.data;
str=msprintf('%0.2g \n %0.2g', pt(1), pt(2))
endfunction
datatipSetDisplay(d1,"mydisplay")
datatipSetStyle(e(1),2,%f)
datatipSetOrientation(d1,"upper left");

d2=datatipCreate(e(2),200);
datatipSetStyle(e(2),1,%t)
datatipSetOrientation(d2,"lower left");
See also
- datatips — Tool for placing and editing tips along the plotted curves
- datatipCreate — Create a datatip on a polyline by program
History
| Версия | Описание |
| 5.4.0 | Function datatipSetStyle introduced. |
| Report an issue | ||
| << datatipSetOrientation | Datatips | datatip properties >> |