bode_asymp
Bode plot asymptote
Syntax
bode_asymp(sl)
bode_asymp(sl, wmin, wmax)
Arguments
- sl
syslinlist (SISO or SIMO linear system) in continuous time (type state-space or rational).- wmin, wmax
Real scalars: lower and upper frequency bounds (in rad/s).
Description
Plots the asymptote of the system
sl.
The optional arguments wmin and wmax (in rad/s) can be used to plot asymptote in a specific range of frequency.
 |
 | Warning: this function is not applicable when the first input argument is a real matrix. |
Examples
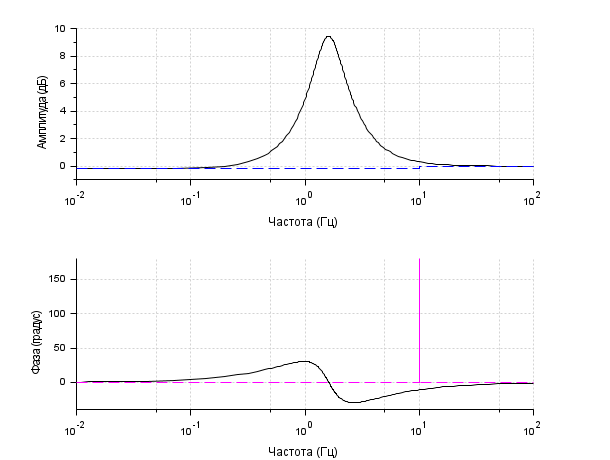
s = poly(0, "s");
h = syslin("c", (s^2+2*0.9*10*s+100)/(s^2+2*0.3*10.1*s+102.01));

clf(); bode(h, 0.01, 100); bode_asymp(h);
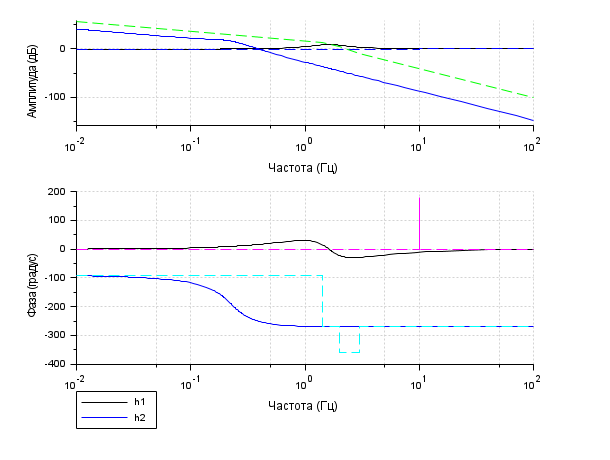
s = poly(0, "s");
h1 = syslin("c", (s^2+2*0.9*10*s+100)/(s^2+2*0.3*10.1*s+102.01));
h2 = syslin("c", (10*(s+3))/(s*(s+2)*(s^2+s+2)));

clf(); bode([h1; h2], 0.01, 100, ["h1"; "h2"]); bode_asymp([h1; h2]);
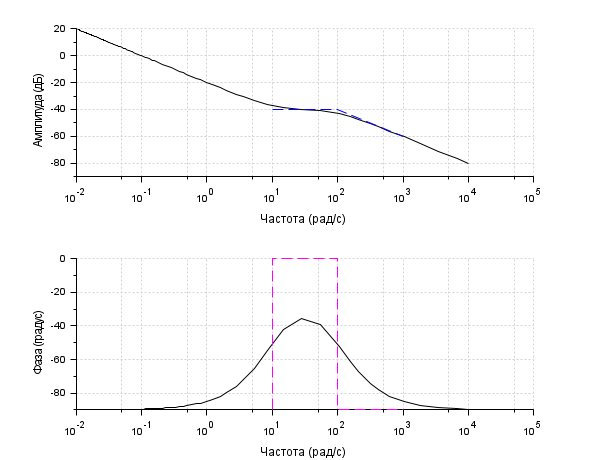
s = %s;
G = (s+10)/(s*(s+100)); // A rational matrix
sys = syslin("c", G); // A continuous-time linear system in transfer matrix representation.
f_min = .0001; f_max = 1600; // Frequencies in Hz

clf(); bode(sys, f_min, f_max, "rad"); // The optional argument "rad" converts Hz to rad/s
bode_asymp(sys, 10, 1000); // Plots asymptotes in the given range of frequency (in rad/s).
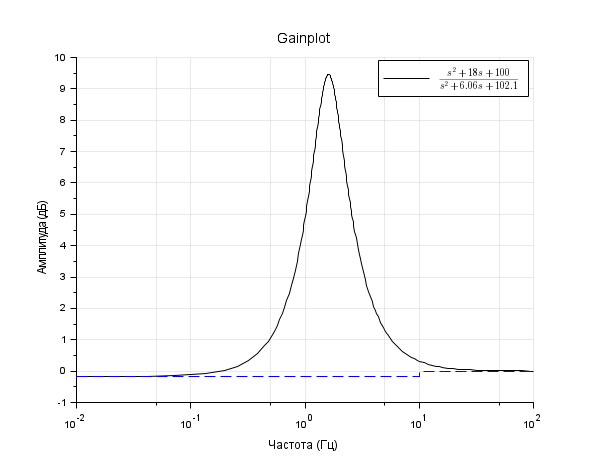
s = poly(0, "s");
h = syslin("c", (s^2+2*0.9*10*s+100)/(s^2+2*0.3*10.1*s+102.01));
h = tf2ss(h);

clf();
gainplot(h, 0.01, 100, "$\frac{s^2+18 s+100}{s^2+6.06 s+102.1}$"); // Frequencies in Hertz
bode_asymp(h)
See also
- bode — Bode plot
- black — Black-Nichols diagram of a linear dynamical system
- nyquist — nyquist plot
- gainplot — magnitude plot
- repfreq — frequency response
- g_margin — gain margin and associated crossover frequency
- p_margin — phase margin and associated crossover frequency
- calfrq — frequency response discretization
- phasemag — phase and magnitude computation
- datatips — Tool for placing and editing tips along the plotted curves
- show_margins — display gain and phase margin and associated crossover frequencies
History
| Версия | Описание |
| 5.5.0 | bode_asymp() function introduced. |
| Report an issue | ||
| << bode | Frequency Domain | calfrq >> |