bar3d
Graphique en barres 3D
Séquence d'appel
bar3d()     // Exemple
bar3d(mtx,[theta,alpha,leg,flag,ebox])
bar3d(mtx,<opt_args>)
bar3d(list(mtx,x,y),[theta,alpha,leg,flag,ebox])
bar3d(list(mtx,x,y),<opt_args>)
Paramètres
- mtx
matrice de taille (m,n) définissant l'histogramme
mtx(i,j)=F(x(i),y(j)), oùxetysont considérés égaux à0:met0:n.- list(mtx,x,y)
où mtx est une matrice de taille (m,n) définissant l'histogramme
mtx(i,j)=F(x(i),y(j)), avecxetydeux vecteurs de tailles respectives (1,m+1) et (1,n+1).- <opt_args>
Représente une séquence de la forme
clé1=valeur1,
                            clé2=valeur2
,... oùclé1, clé2,...peut être n'importe quel paramètre optionnel de plot3d (theta,alpha,leg,flag,ebox).- theta,alpha,leg,flag,ebox
voir plot3d.
Description
bar3d représente un histogramme 2D dans
l'espace. Les valeurs sont associées aux intervalles
[x(i), x(i+1)[ × [y(i), y(i+1)[.
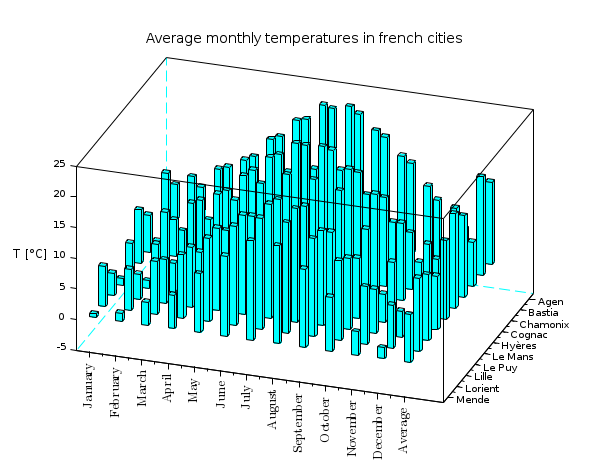
bar3d() affiche un exemple illustrant la fonction.
Exemples
bar3d();
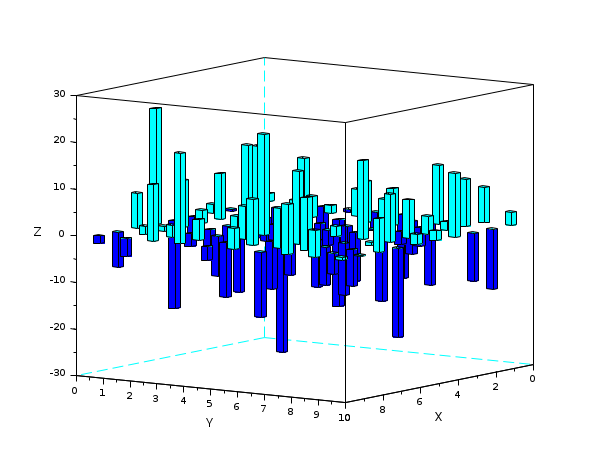
bar3d(grand(10, 10, "nor", 0, 10))
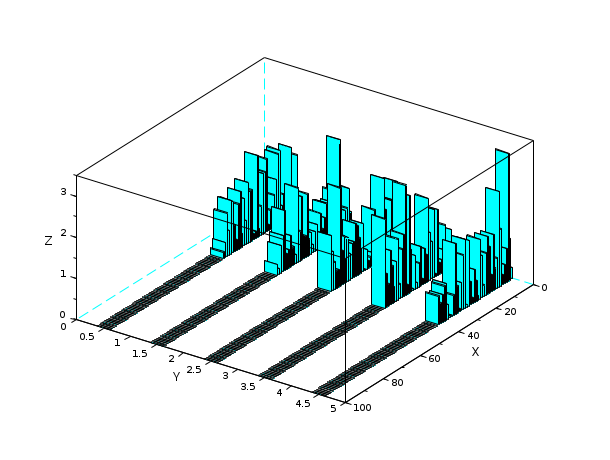
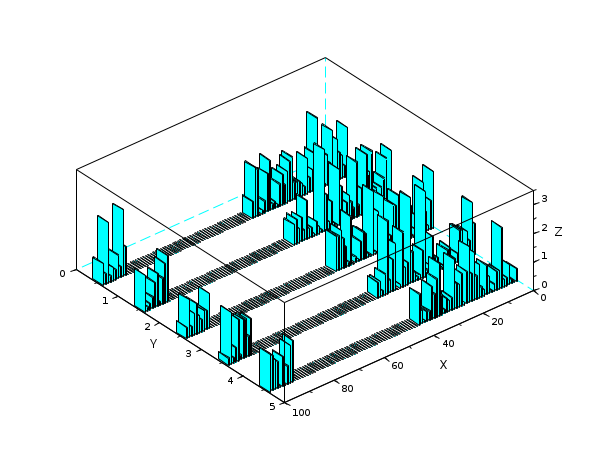
Z = zeros(100,5);
A = abs(rand(40,5));
Z(1:40,:) = A;
Index = find(Z==0);
Z(Index) = %nan;

clf
bar3d(Z)
isoview off
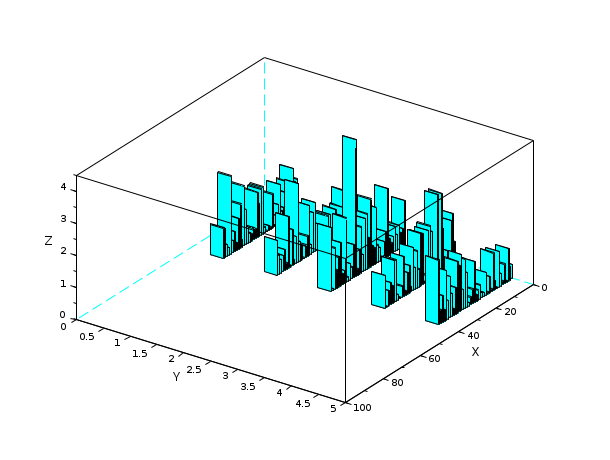
Z = zeros(100,5);
A = abs(rand(40,5));
Z(1:40,:) = A;
A = abs(rand(10,5));
Z(91:100,:) = A;

clf
bar3d(Z)
isoview off
Historique
| Version | Description |
| 6.1.0 | hist3d() a été renommé en bar3d(). |
| Report an issue | ||
| << 3d_plot | 3d_plot | comet3d >> |