Please note that the recommended version of Scilab is 2026.0.1. This page might be outdated.
See the recommended documentation of this function
xstring
draw strings
Syntax
xstring(x, y, str)
xstring(x, y, str, angle)
xstring(x, y, str, angle, box)
Arguments
- x,y
real vectors or scalars, coordinates of the lower-left point of the strings.
- str
matrix of strings.
Starting from Scilab 5.2, it is possible to write LaTeX or MathML expression.
- angle
real vector or scalar, clockwise angle in degree; default is 0.
- box
integer vector or scalar, default is 0.
Description
If x is a real scalar, it's regarded as a vector with the size of y whose elements are set to x.
If y is a real scalar, it's regarded as a vector with the size of x whose elements are set to y.
xstring draws n strings at location (x[i], y[i]) in the current graphic scale.
If str contain n elements, these n elements are the n drawn strings.
Otherwise, each row of the matrix stands for a line of text and row elements stand for words separated by a white space.
If angle is a real scalar, it's regarded as a vector of size n whose elements are set to angle.
angle(i)gives the slope in degree used for drawing the strings at location (x[i], y[i]).
If box is an integer scalar, it's regarded as a vector of size n whose elements are set to box.
If box(i) is 1 and angle(i) is 0, a box is drawn around the strings at location (x[i], y[i]).
Examples
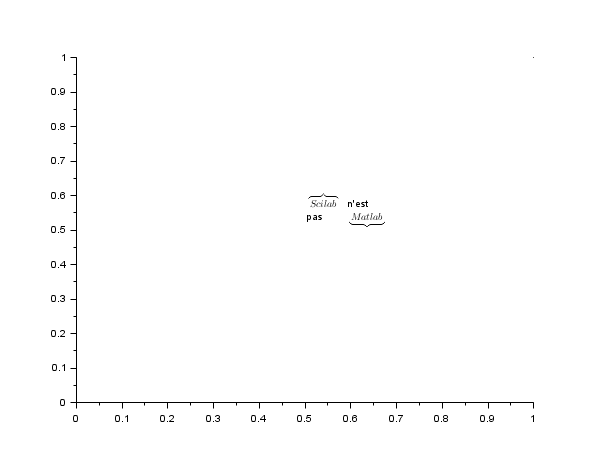
plot2d([0;1],[0;1],0)
xstring(0.5,0.5,["$\overbrace{Scilab}$" "n''est ";"pas" "$\underbrace{Matlab}$"])
// LaTeX rendering (>= Scilab 5.2)

//Other example
alphabet=["a" "b" "c" "d" "e" "f" "g" ..
          "h" "i" "j" "k" "l" "m" "n" ..
          "o" "p" "q" "r" "s" "t" "u" ..
          "v" "w" "x" "y" "z"];
clf()
plot2d([0;1],[0;2],0)
xstring(0.1,1.8,alphabet)     // alphabet
xstring(0.1,1.6,alphabet,0,1) // alphabet in a box
xstring(0.1,1.4,alphabet,20)  // angle
set(gca(), "font_style", 1, "font_size", 1);  // use symbol fonts
xstring(0.1,0.1,alphabet)
xstring(0.1,0.3,alphabet)
gce().font_size = 3;          // change the font size
xstring(0.1,0.6,"a")    //big alpha
gce().font_size = 24;

See also
- text_properties — description of the Text entity properties
- Math mode in strings — Display mathematical equations in Scilab graphics through the LaTeX or MathML languages.
- xnumb — draw numbers
- xtitle — add titles on a graphics window
- titlepage — add a title in the middle of a graphics window
| Report an issue | ||
| << xnumb | text | xstringb >> |