Scilab 6.0.1
Please note that the recommended version of Scilab is 2026.0.1. This page might be outdated.
See the recommended documentation of this function
subplot
virtually grids the figure and sets the plotting area to a chosen cell
Syntax
subplot(m,n,p)
subplot(mnp)
Arguments
- m,n,p
positive integers
- mnp
an integer with decimal notation
mnp
Description
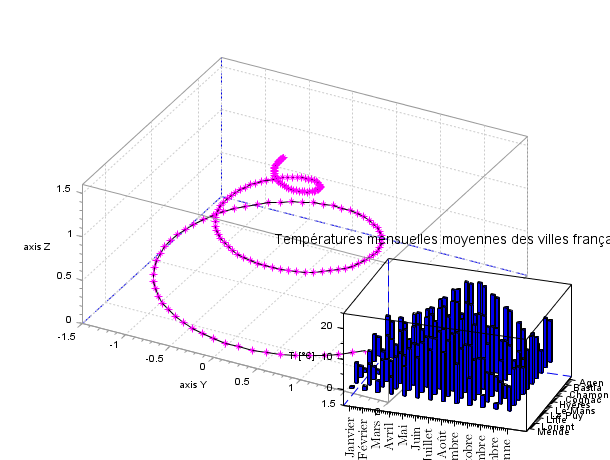
subplot(m,n,p) or subplot(mnp) breaks the graphics window into an m-by-n matrix of sub-windows and selects the p-th sub-window for drawing the current plot. The number of a sub-window into the matrices is counted row by row ie the sub-window corresponding to element (i,j) of the matrix has number (i-1)*n + j.
Examples

See also
| Report an issue | ||
| << square | axes_operations | unzoom >> |