errbar
ajoute des barres d'erreur sur un dessin 2D
Séquence d'appel
errbar(x,y,em,ep)
Paramètres
- x,y,em,ep
4 matrices de même taille.
Description
errbar ajoute des barres d'erreur sur un dessin 2D.
x et y ont la même signification que dans plot2d.
em(i,j) et ep(i,j) représentent l'intervalle d'erreur autour de la valeur
y(i,j) : [y(i,j)-em(i,j),y(i,j)+ep(i,j)].
Taper errbar() pour voir une démonstration de la fonction.
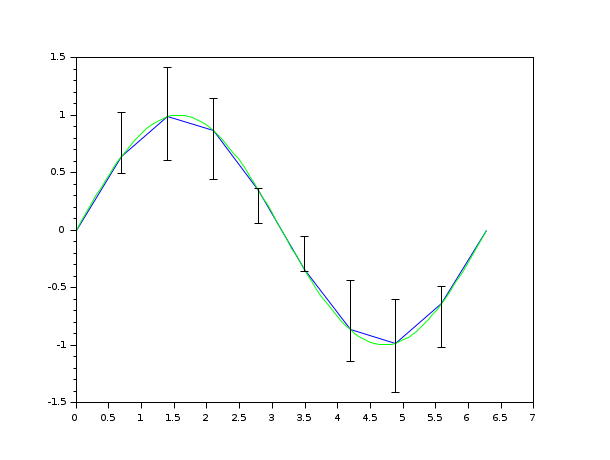
Exemples
// low resolution sinus
x1 = linspace(0, 2*%pi, 10);
y1 = sin(x1);
plot(x1, y1, 'b');

// high resolution sinus
x2 = linspace(0, 2*%pi, 100);
y2 = sin(x2);
plot(x2, y2, 'g');

// display the error between a linear interpolation and x2
x_err = x1(2:$-1);
y_err = y1(2:$-1);
err = y2 - linear_interpn(x2, x1, y1, "periodic");
err_m = zeros(y_err);
err_p = zeros(y_err);
for i = 2:size(x1,'c')-1
    err_m(i-1) = sum(abs(err(x1(i-1) <= x2 & x2 < x1(i)  )));
    err_p(i-1) = sum(abs(err(x1(i)   <= x2 & x2 < x1(i+1))));
end
errbar(x_err, y_err, err_m, err_p);
Voir aussi
- plot2d — 2D plot
| Report an issue | ||
| << cutaxes | 2d_plot | fchamp >> |