Please note that the recommended version of Scilab is 2026.0.1. This page might be outdated.
See the recommended documentation of this function
text properties
description of the Text entity properties
Description
The Text entity is a leaf of the graphics entities hierarchy. This entity defines the parameters for string drawing
- parent:
This property contains the handle of the parent. The parent of the text entity should be of the type
"Axes"or"Compound".- children:
This property contains a vector with the
childrenof the handle. However, text handles currently do not have anychildren.- visible:
This field contains the
visibleproperty value for the entity . It should be"on"or"off". By default, the text is visible, the value's property is"on". If"off"the text is not displayed on the screen.- text:
the matrix containing the strings of the object. The rows of the matrix are displayed horizontally, and the columns vertically.
- data:
Vector
[x,y,[z]]setting the position of the pivot of the text, in data units of the axes. By default, the pivot is set on the lower left corner of the framing box of the block of text.
e = gce(); e.text_box=[0 0]; e.text_box_mode="centered"centers the framing box on the pivot, so at the.dataposition.- font_angle:
This property sets the orientation of the block of text around its pivot, in clockwise degrees starting from the (0-right) direction (it is definitely not related to the font slanting).
- alignment:
Specifies how the strings are aligned in their columns. The value must be
"left","center"or"right". It applies to all columns.- font_style:
Specifies the font used to display the character strings. This is a positive integer referencing one of the loaded fonts. Its value must be between 0, referencing the first font, and the number of loaded fonts minus one, referencing the last font. For more information see graphics_fonts.
- font_foreground:
This field contains the color used to display the characters of the text. Its value should be a color index (relative to the current colormap).
- font_size:
It is a scalar specifying the displayed characters size. If
fractional_fontproperty is"off"only the integer part of the value is used. For more information see graphics_fonts.- fractional_font:
This property specify whether text is displayed using fractional font sizes. Its value must be either
"on"or"off". If"on"the floating point value offont_sizeis used for display and the font is anti-aliased. If"off"only the integer part is used and the font is not smoothed.- box:
"on": a box is drawn around the block of text, made of a boxing frame or/and a filling background.- "off" (default): no box is drawn.
- line_mode:
"on": draws a line as box border, provided that.box="on"as well. The border's color is then set with.foreground."off": no line as box border is drawn. The box's filling background is independently enabled/disabled with the.fill_modeproperty.
- foreground:
Color's index of the line used to draw the edge of the box when
.box="on"and.line_mode="on". Its value refers to the current colormap.-1is black (default) and-2is white whatever is the colormap.- fill_mode:
"on": enables the box background, provided that.box="on"as well. The background's color can then be set with the.backgroundproperty."off"(default): disables the box background, that becomes transparent.- background:
Index of the color used to fill the box around of the text, provided that
.box="on"and.fill_mode="on". The color index is relative to the current colormap. Whatever is the colormap,-1is black (default) and-2is white.- text_box:
A two dimensional vector specifying the size of a rectangle in user coordinates. The rectangle is used when the text_box_mode property is set to
"centered"or"filled".- text_box_mode:
"off": the strings are displayed using the given font, and.dataspecifies the position of the lower-left corner of the frame boxing the whole block of text."centered": the text is displayed in the middle of the rectangle whose size is given by.text_box."filled": the font size of the strings will be expanded to fill the rectangle. Zooming updates the font size accordingly.
When using the
"off"or the"centered"modes, the text size remains constant upon zooming. They are the best modes to create annotations in a graph.- auto_dimensionning:
auto_dimensionning set to "off" is equivalent to text_box_mode set to "filled". If text_box_mode is "off" or "centered" then it implies that auto_dimensionning is "on".
- clip_state:
This field contains the
clip_stateproperty value for the text. Its value should be :"off"this means that the text is not clipped."clipgrf"this means that the text is clipped outside the Axes box."on"this means that the text is clipped outside the rectangle given by the propertyclip_box.
- clip_box:
This field contains the
clip_boxproperty. Its value should be an empty matrix if clip_state is "off" or the vector[x,y,w,h] (upper-left point width height).- user_data:
This field can be use to store any scilab variable in the text data structure, and to retrieve it.
Examples
a=get("current_axes");
a.data_bounds=[0,0;1,1];
a.axes_visible = 'on' ;

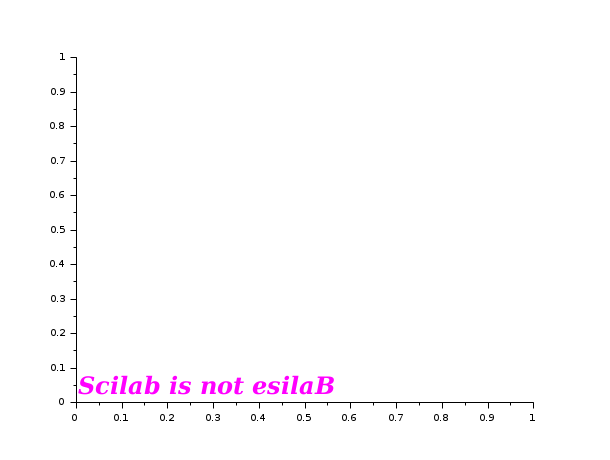
xstring(0.5,0.5,"Scilab is not esilaB",0,0)

t = gce();   // get the handle of the newly created object

t.font_foreground=6; // change font properties
t.font_size=5;
t.font_style=5;

t.text=["SCILAB","is";"not","esilaB"] ; // change the text
t.font_angle=90 ; // turn the strings
t.text_box = [0,0] ;
t.text_box_mode = 'centered' ; // the text is now centered on [0.5,0.5].
t.alignment = 'center' ;
t.box = 'on' ; // draw a box around the text

// Using LaTeX and MathML:
mathml = "<mrow><mfrac><mrow> <mi>d</mi> <mi>y</mi> </mrow>" + ..
                      "<mrow> <mi>d</mi> <mi>x</mi> </mrow>" + ..
               "</mfrac>" + ..
               "<mo> = </mo>" + ..
               "<mfrac> <mn>1</mn> <msup><mi>y</mi> <mn>2</mn> </msup> </mfrac>" + ..
         "</mrow>";
t.text=["SCILAB","can write LaTeX :","$\frac{abc}{xyz}$";"or","MathML :",mathml] ;

See also
- xstring — draw strings
- label_properties — Properties of Axes labels and title
- legend_properties — description of the Legend entity properties.
- xtitle — add titles on a graphics window
- graphics_entities — описание структур данных графических объектов
- LaTeX or MathML expression — Display mathematical equations in Scilab graphics through the LaTeX or MathML languages.
History
| Версия | Описание |
| 5.0 | .text_box, .text_box_mode,
.alignment, and .auto_dimensionning
properties added. |
| 5.2 | LaTeX and MathML expressions are now supported. |
| Report an issue | ||
| << stringbox | text | titlepage >> |