Please note that the recommended version of Scilab is 2026.0.1. This page might be outdated.
However, this page did not exist in the previous stable version.
captions
draw graph captions
Syntax
hl=captions(h, strings [,location])
Arguments
- h
vector of handles on polyline entities.
- strings
n vector of strings, strings(i) is the caption of the ith polyline
- hl
a handle of type "
Legend", points to the structure containing all the captions information (see legend_properties.
- location
a character string with possible values:
"in_upper_right": captions are drawn in the upper right corner of the axes box."in_upper_left": captions are drawn in the upper left corner of the axes box."in_lower_right": captions are drawn in the lower right corner of the axes box."in_lower_left": captions are drawn in the lower left corner of the axes box."out_upper_right": captions are drawn at the right of the upper right corner of the axes box."out_upper_left": captions are drawn at the left of the upper left corner of the axes box."out_lower_right": captions are drawn at the right of the lower right corner of the axes box."out_lower_left": captions are drawn at the left of the lower left corner of the axes box."upper_caption": captions are drawn above the upper left corner of the axes box."lower_caption": captions are drawn below the lower left corner of the axes box. This option correspond to thelegargument of plot2d"by_coordinates": the upper left corner of the captions box is given by the "position" field of the associated data structure. Thexandypositions are given as fractions of theaxes_bounds sizes.
Description
Puts captions on the current plot at the in the bottom left corner
of the graphic window using the specified strings as labels.
captions prepends labels by a recall of the
corresponding polylines. The type and properties are recovered from the
given handles:
The captions function creates a Legend data structure.
There is at most one Legend associated with each
axes. If the caption function is recalled while a
Legend still exist the old one is replaced.
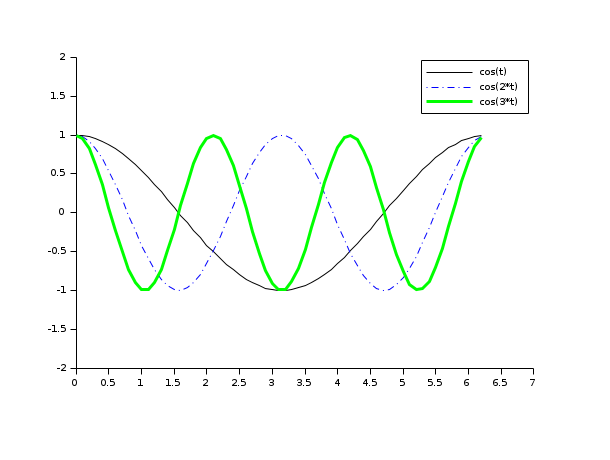
Examples
t=0:0.1:2*%pi;
a=gca();a.data_bounds=[t(1) -1.8;t($) 1.8];
a.margins(4)=0.2;

plot2d(t,[cos(t'),cos(2*t'),cos(3*t')],[1,2 3]);
e=gce();
e.children(1).thickness=3;
e.children(2).line_style=4;

hl=captions(e.children,['cos(t)';'cos(2*t)';'cos(3*t)']);
hl=captions(e.children,['cos(t)';'cos(2*t)';'cos(3*t)'],'in_upper_right');

hl.legend_location='in_upper_right'
hl.fill_mode='on';

See also
- plot2d — 2D plot
- legend — draw graph legend
- polyline_properties — description of the Polyline entity properties
- legend_properties — description of the Legend entity properties.
| Report an issue | ||
| << annotation | annotation | Label entity properties >> |