Scilab 6.1.0
Please note that the recommended version of Scilab is 2026.1.0. This page might be outdated.
See the recommended documentation of this function
xnumb
draw numbers
Syntax
xnumb(x, y, nums, [box, angle])
Arguments
- x, y, nums
vectors of same size.
- box
an integer value.
- angle
an optional vector of same size as
x
Description
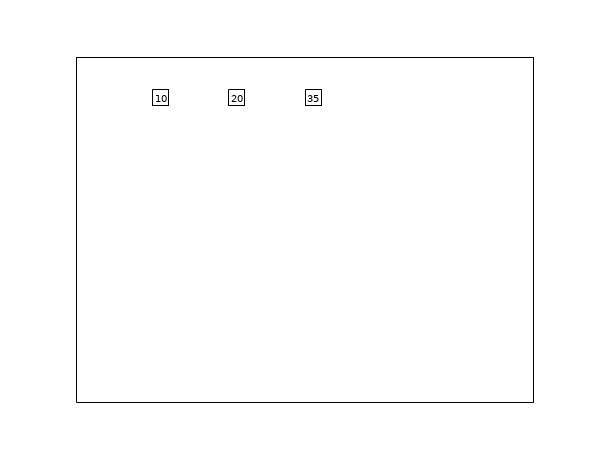
xnumb draws the value of nums(i)
at position x(i), y(i) in the current scale.
If box is 1, a box is drawn around the numbers.
If angle is given, it gives the direction for string drawing.
 | Note that a maximum of 4 significant digits of each element of nums
will be displayed. |
See also
- xstring — draw strings
| Report an issue | ||
| << xlfont | text | xstring >> |