Please note that the recommended version of Scilab is 2026.1.0. This page might be outdated.
See the recommended documentation of this function
xfpolys
fill a set of polygons
Syntax
xfpolys(xpols,ypols,[fill])
Arguments
- xpols,ypols
matrices of the same size (p,n) (points of the polygons).
- fill
vector of size n or of size (p,n)
Description
xfpolys fills a set of polygons of the same size defined by
the two matrices xpols and ypols.
The coordinates of each polygon
are stored in a column of xpols and ypols.
The polygons may be filled with a given color (flat) or painted with interpolated (shaded) colors.
- flat color painting
In this case
fillshould be a vector of sizen. The pattern for filling polygon number i is given byfill(i):if
fill(i)<0, the polygon is filled with pattern id-fill(i).if
fill(i)=0, the polygon is drawn with the current dash style (or current color) and not filled.if
fill(i)>0, the polygon is filled with pattern idfill(i). Then its contour is drawn with the current dash (or color) and closed if necessary.
- interpolated color painting
In this case
fillshould be a matrix with same sizes asxpolsandypols. Note thatpmust be equal to 3 or 4.fill(k,i)gives the color at thekth edge of polygoni.
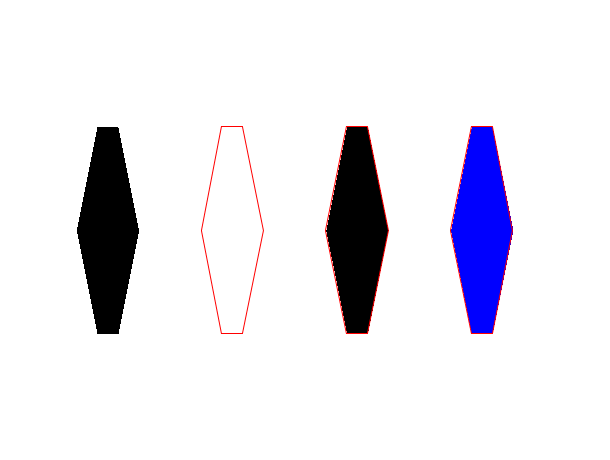
Examples
a=gca();
a.data_bounds=[0,-10;210,40];
a.foreground=color('red');
x1=[0,10,20,30,20,10,0]';
y1=[15,30,30,15,0,0,15]';
xpols=[x1 x1 x1 x1];
xpols=xpols+[0,60,120,180].*.ones(x1);
ypols=[y1 y1 y1 y1];
xfpolys(xpols,ypols,[-1,0,1,2])
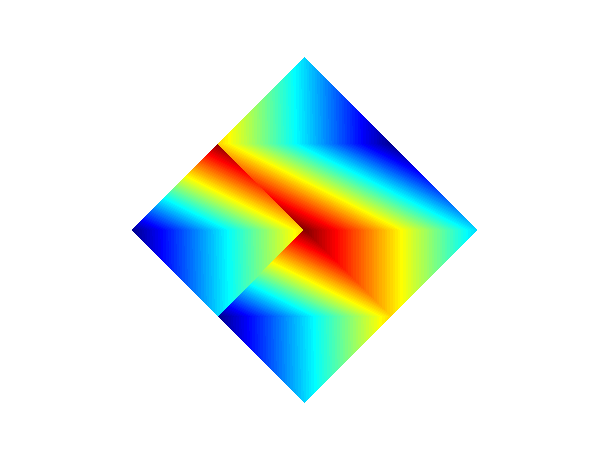
// interpolated colors
clf()
f=gcf();
a=gca();
a.data_bounds=[0,-10;40,30];
isoview();
x1=[0,10,20,10]';
y1=[10,0,10,20]';
c=linspace(2,100,4)';
xpols=[x1 x1+20 x1+10 x1+10];
ypols=[y1 y1    y1+10 y1-10];
cols= [c c($:-1:1) c([3 4 1 2]) c]
f.color_map=jetcolormap(max(cols));
xfpolys(xpols,ypols,cols)
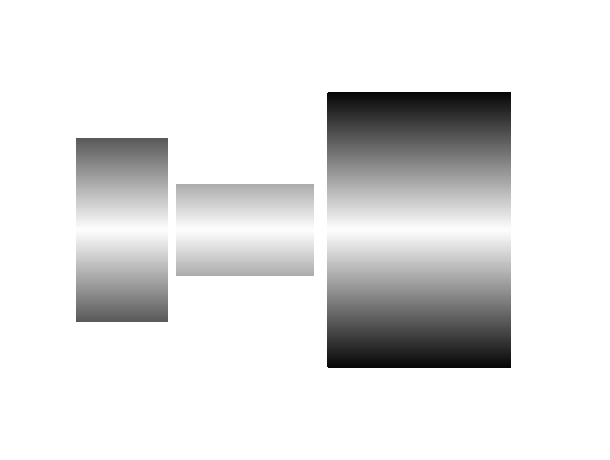
// interpolated colors
clf()
f=gcf();
x11=[0;20;20;0];
y11=[10;10;30;30];
c11=[10;10;30;30];
x12=x11;
y12=y11+20;
c12=[20;20;1;1];
c12=[30;30;10;10];
x21=[0;30;30;0]+22;
y21=[20;20;30;30];
c21=[20;20;30;30];
x22=x21;
y22=y21+10;
c22=[30;30;20;20];
x31=[0;40;40;0]+55;
y31=[0;0;30;30];
c31=[0;0;30;30];
x32=x31;
y32=y31+30;
c32=[30;30;0;0];
X=[x11 x12 x21 x22 x31 x32];
Y=[y11 y12 y21 y22 y31 y32];
C=([c11 c12 c21 c22 c31 c32]+1)*5;
a=gca();
isoview();
a.data_bounds=[min(X),min(Y);max(X),max(Y)];
f=gcf();
f.color_map=graycolormap(max(C));
xfpolys(X,Y,C)
See also
| Report an issue | ||
| << xfpoly | polygon | xpoly >> |