Scilab 6.0.2
- Scilabヘルプ
- Graphics
- 2d_plot
- 3d_plot
- annotation
- axes_operations
- axis
- bar_histogram
- Color management
- Datatips
- figure_operations
- geometric_shapes
- handle
- interaction
- lighting
- load_save
- polygon
- property
- text
- transform
- Compound_properties
- GlobalProperty
- Graphics: Getting started
- graphics_entities
- object_editor
- pie
- xchange
- xget
- xgetech
- xset
Please note that the recommended version of Scilab is 2026.0.1. This page might be outdated.
See the recommended documentation of this function
pie
円グラフを描画
呼び出し手順
pie(x)

pie(x[,sp[,txt]])
引数
- x
正の実数のスカラーまたはベクトル.
- sp
実数のスカラーまたはベクトル.
- txt
文字列のセルまたはベクトルs.
説明
pie(x): xの大きさがNの場合,
pie 関数はN個の要素からなる円グラフを描画します.この際,
i番目の要素の面積は(x(i)/sum(x))*(単位円の面積)となります.
pie(x,sp):
spベクトルにより円グラフに一つまたは複数の要素を切り出すことが
できます(spの大きさをNとする必要があります).
spのi番目のインデクスの値が0以外の場合,i番目の要素は
その他の要素から空間的に切り出されます.
そうでない場合, この値は 0 となり,
その他の要素に結合されます.
pie(x,txt): txt ベクトルにより
円グラフの各部分のテキストを書くことができます.
txtのi番目の要素はi番目の要素に対応します.
(デフォルト: その部分の面積に対応するパーセンテージで描画されます).
txt の大きさは N に等しくする必要があります.
例
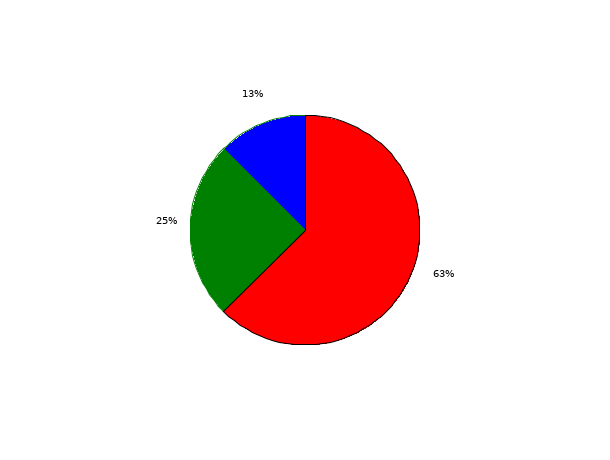
// 最初の例 : 入力引数は1つ  x=[1 2 5]

scf(0);

pie([1 2 5]);

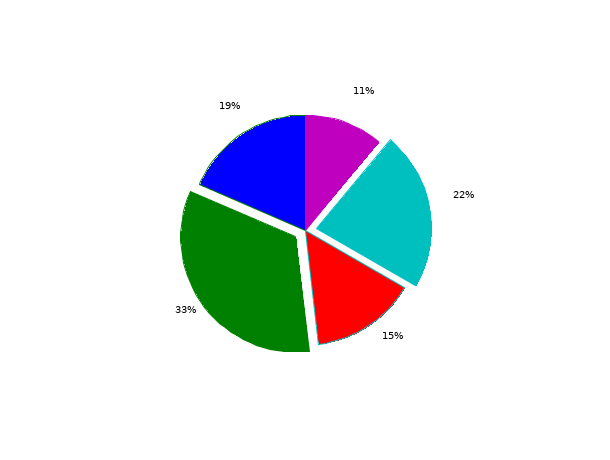
// 2番目の例 : 入力引数は2つ x=[5 9  4 6 3], sp=[0 1 0 1 0],

// 2番目と4番目は他の要素とは区別されています.

scf(1);

pie([5 9 4 6 3],[0 1 0 1 0]);

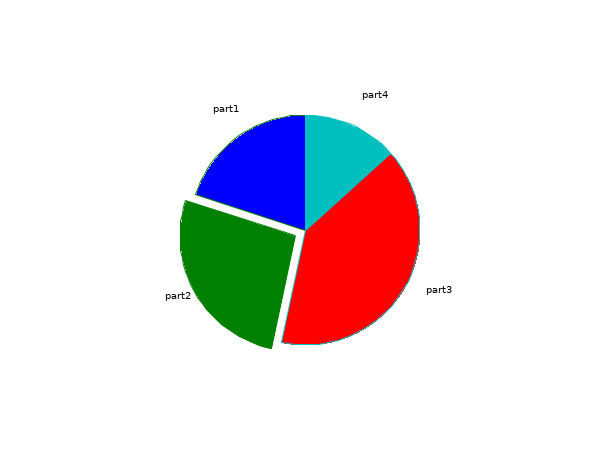
// 第3の例 : 入力引数, x=[3 4 6 2], sp=[0 1 0 0], txt=["part1","part2","part3","part4"]

scf(2);

pie([3 4 6 2],[0 1 0 0],["part1","part2","part3","part4"]);

参照
- xfpolys — 一連のポリゴンを塗りつぶす
| Report an issue | ||
| << object_editor | Graphics | xchange >> |