- Scilab Help
- Graphics
- 2d_plot
- 3d_plot
- annotation
- axes_operations
- axis
- bar_histogram
- Color management
- Datatips
- figure_operations
- geometric_shapes
- handle
- interaction
- lighting
- load_save
- polygon
- property
- text
- transform
- GlobalProperty
- Graphics: Getting started
- Compound properties
- Graphics Entities
- object editor
- pie
- xchange
- xget
- xgetech
- xset
Please note that the recommended version of Scilab is 2026.1.0. This page might be outdated.
However, this page did not exist in the previous stable version.
xgetech
get the current graphics scale (obsolete)
Syntax
[wrect, frect, logflag, arect] = xgetech()
Arguments
- wrect, frect
real vectors.
- logflag
string of size 2
"xy".
Description
 | This function is obsolete. It will be removed from Scilab 6.1. Please use
ax=gca(); (ax.axes_bounds, ax.data_bounds(:)', ax.log_flags, ax.margins)
or any combination instead. |
xgetech returns the current graphics scale (of
the current window). The rectangle [xmin, ymin, xmax,
ymax]
given by frect is the size of the
whole graphics window. The plotting will be made in the region of
the current graphics window specified by wrect.
wrect=[x, y, w, h] (upper-left point, width,
height) describes a region inside the graphics window. The values in
wrect are specified using proportion of the width
and height of the graphics window:
wrect=[0, 0, 1, 1] means that the whole graphics
window is used.
wrect=[0.5, 0, 0.5, 1] means that the graphics
region is the right half of the graphics window.
logflag is a string of size 2
"xy", where x and
y can be "n" or
"l". "n" stands for normal (linear) scale and "l" stands for logscale.
x stands for the x-axis and y
stands for the y-axis.
arect = [x_left, x_right, y_up, y_down] gives the
frame size inside the subwindow. The graphic frame is specified
(like wrect) using proportion of the width or
height of the current graphic subwindow. Default value is
1/8*[1,1,1,1]. If arect is not
given, current value remains unchanged.
Examples
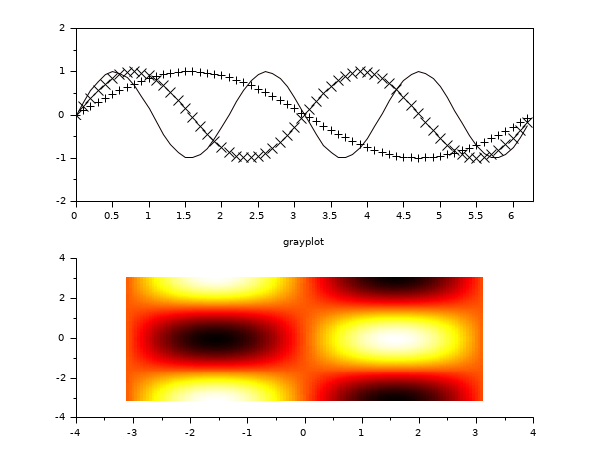
// first subwindow
xsetech([0,0,1.0,0.5])
plot2d()
// then xsetech is used to set the second sub window
xsetech([0,0.5,1.0,0.5])
grayplot()
// get the graphic scales of first subwindow
xsetech([0,0,1.0,0.5])
[wrect,frect,logflag,arect]=xgetech();
// get the graphic scales of second subwindow
xsetech([0,0.5,1.0,0.5])
[wrect,frect,logflag,arect]=xgetech();
See also
- xsetech — set the sub-window of a graphics window for plotting
History
| Version | Description |
| 6.0.1 | xgetech() is tagged obsolete for removal from Scilab 6.1. |
| Report an issue | ||
| << xget | Graphics | xset >> |