Please note that the recommended version of Scilab is 2026.1.0. This page might be outdated.
See the recommended documentation of this function
drawaxis
draw an axis
Syntax
drawaxis([options]); // options: x,y,dir,sub_int,fontsize,format_n,seg,textcolor,ticscolor,tics
e = drawaxis([options]);
Arguments
- dir=string
used to specify the tics direction.
stringcan be chosen among 'u','r','d','l' and 'l' is the default value. the values 'u','r','d','l' stands respectively for up, right, down, left- tics=string
A flag which describes how the tics are given.
stringcan be chosen among 'v','r', and 'i', and, 'v' is the default value- x,y
two vectors which give tics positions.
- val= string matrix
A string matrix, which, when given, gives the string to be drawn along the axis at tics positions.
- fontsize=int
specifies the fontsize to use for displaying values along the axis. Default value is
-1which stands for current fontsize- format_n=string
format to use for displaying numbers along the axis, where
stringgives the format according to the C language printf function format syntax (for examplestring="%.3f").- seg= 1 or 0
A flag which controls the display of the base segment of the axis (default value is 1).
- sub_int=integer
an integer which gives the number of sub-intervals to draw between large tics.
- textcolor=integer
specify the color to use for displaying values along the axis. Default value is
-1which stands for current color.- ticscolor=integer
specify the color to use for tics drawing. Default value is
-1which stands for current color.- e
handle, the handle of the created axis.
Description
drawaxis is used to draw an axis in vertical or horizontal
direction. This function returns the handle of the created axis.
The direction of the axis is given by dir
dir = 'u' or 'd' gives a horizontal axis
with tics going up ('u') or down ('d').
dir = 'r' or 'l' give a vertical axis
with tics going right ('r') or left ('l').
x and y give the axis tics positions.
If the axis is horizontal then y
must be a scalar or can be omitted and x
is a Scilab vector. The meaning of x
is controlled by tics.
If tics='v' then x gives the tics positions along the x-axis.
If tics='r' then x must be of size 3. x=[xmin,xmax,n] and
n gives the number of intervals.
If tics='i' then x must be of size 4, x=[k1,k2,a,n].
then xmin=k1*10^a, xmax=k2*10^a and n gives the number of intervals
If y is omitted then the axis will be positioned at
the top of the frame if dir='u' or at the bottom if dir='d'
By default, numbers are drawn along the axis. They are drawn using
a default format which can be changed with format_n.
It is also possible to display given strings and not numbers,
this is done if val is provided. The size of val must
match the number of tics.
Examples
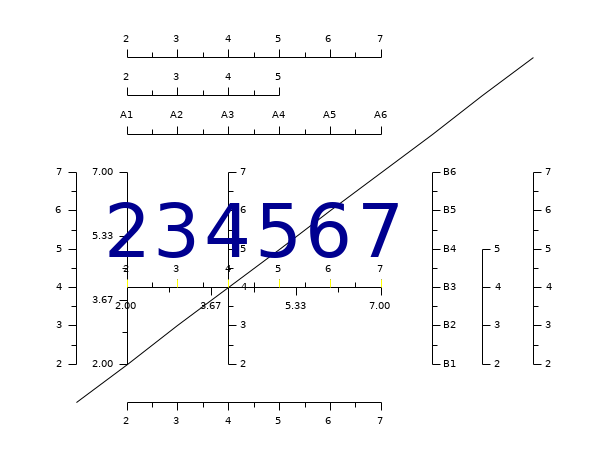
plot2d(1:10,1:10,1,"020")
// horizontal axis
e = drawaxis(x=2:7,y=4,dir='u',tics='v')
// horizontal axis on top of the frame
drawaxis(x=2:7,dir='u',tics='v')
// horizontal axis at the bottom of the frame
e = drawaxis(x=2:7,dir='d',tics='v')

// horizontal axis given by a range
drawaxis(x=[2,7,3],y=4,dir='d',tics='r')

// vertical axis
e = drawaxis(x=4,y=2:7,dir='r',tics='v')
e = drawaxis(x=2,y=[2,7,3],dir='l',tics='r')
e = drawaxis(y=2:7,dir='r',tics='v')
e = drawaxis(y=2:7,dir='l',tics='v')

// horizontal axis with strings displayed at tics positions
drawaxis(x=2:7,y=8,dir='u',tics='v',val='A'+string(1:6));
// vertical axis with strings displayed at tics positions
drawaxis(x=8,y=2:7,dir='r',tics='v',val='B'+string(1:6));

// horizontal axis given with a 'i' range.
e = drawaxis(x=[2,5,0,3],y=9,dir='u',tics='i');
e = drawaxis(x=9,y=[2,5,0,3],dir='r',tics='i',sub_int=5);

// horizontal axis again
drawaxis(x=2:7,y=4,dir='u',tics='v',fontsize=10,textcolor=9,ticscolor=7,seg=0,sub_int=20)
See also
- axis_properties — description of the axis entity properties
| Report an issue | ||
| << axis properties | axis | graduate >> |