Please note that the recommended version of Scilab is 2026.1.0. This page might be outdated.
See the recommended documentation of this function
plot3d2
plot surface defined by rectangular facets
Syntax
plot3d2(X,Y,Z [,vect,theta,alpha,leg,flag,ebox])
plot3d2(X,Y,Z, <opt_args>)
Arguments
- X, Y, Z:
3 real matrices defining a data structure.
- vect
a real vector.
- <opt_args>
This represents a sequence of statements
key1=value1, key2=value2,... wherekey1,key2,...can be one of the following: theta, alpha ,leg,flag,ebox (see definition below).- theta, alpha
real values giving in degree the spherical coordinates of the observation point.
- leg
string defining the labels for each axis with @ as a field separator, for example "X@Y@Z".
- flag
a real vector of size three.
flag=[mode,type,box].- mode
an integer (surface color).
- mode>0
the surface is painted with color
"mode"; the boundary of the facet is drawn with current line style and color.- mode=0:
a mesh of the surface is drawn.
- mode<0:
the surface is painted with color
"-mode"; the boundary of the facet is not drawn.Note that the surface color treatment can be done using
color_modeandcolor_flagoptions through the surface entity properties (see surface_properties).
- type
an integer (scaling).
- type=0:
the plot is made using the current 3D scaling (set by a previous call to
param3d,plot3d,contourorplot3d1).- type=1:
rescales automatically 3d boxes with extreme aspect ratios, the boundaries are specified by the value of the optional argument
ebox.- type=2:
rescales automatically 3d boxes with extreme aspect ratios, the boundaries are computed using the given data.
- type=3:
3d isometric with box bounds given by optional
ebox, similarily totype=1.- type=4:
3d isometric bounds derived from the data, to similarily
type=2.- type=5:
3d expanded isometric bounds with box bounds given by optional
ebox, similarily totype=1.- type=6:
3d expanded isometric bounds derived from the data, similarily to
type=2.Note that axes boundaries can be customized through the axes entity properties (see axes_properties).
- box
an integer (frame around the plot).
- box=0:
nothing is drawn around the plot.
- box=1:
unimplemented (like box=0).
- box=2:
only the axes behind the surface are drawn.
- box=3:
a box surrounding the surface is drawn and captions are added.
- box=4:
a box surrounding the surface is drawn, captions and axes are added.
Note that axes aspect can also be customized through the axes entity properties (see axes_properties).
- ebox
It specifies the boundaries of the plot as the vector
[xmin,xmax,ymin,ymax,zmin,zmax]. This argument is used together withtypeinflag: if it is set to1,3or5(see above to see the corresponding behaviour). Ifflagis missing,eboxis not taken into account.Note that, when specified, the
eboxargument acts on thedata_boundsfield that can also be reset through the axes entity properties (see axes_properties).
Description
plot3d2 plots a surface defined by rectangular facets.
(X,Y,Z) are three matrices which describe a surface. The surface is
composed of four sided polygons.
The X-coordinates of a facet are given by X(i,j), X(i+1,j), X(i+1,j+1) and X(i,j+1). Similarly Y and Z matrices contain Y and Z-coordinates.
The vect vector is used when multiple surfaces
are coded in the same (X,Y,Z) matrices. vect(j) gives the
line at which the coding of the jth surface begins. Like in
plot3d, the same properties are editable (see
surface_properties and axes_properties).
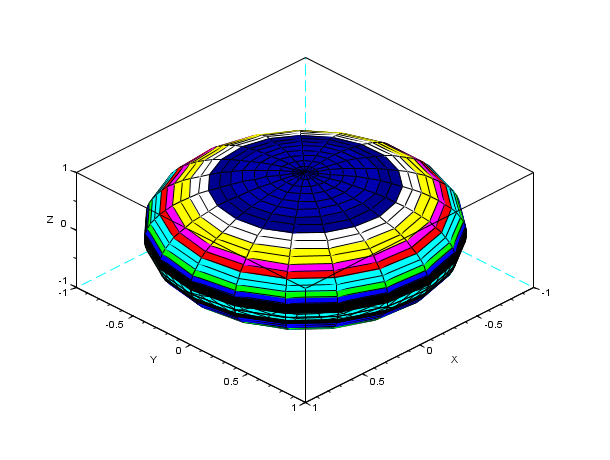
Examples
u = linspace(-%pi/2,%pi/2,40);
v = linspace(0,2*%pi,20);
X = cos(u)'*cos(v);
Y = cos(u)'*sin(v);
Z = sin(u)'*ones(v);
plot3d2(X,Y,Z);
e=gce();
e.color_mode=4; // change color
f_data=e.data;
TL = tlist(["3d" "x" "y" "z" "color"],f_data.x,f_data.y,f_data.z,10*(f_data.z)+1);
e.data=TL;
e.color_flag=2;
| Report an issue | ||
| << plot3d1 | 3d_plot | plot3d3 >> |