Scilab 6.0.1
Please note that the recommended version of Scilab is 2026.0.1. This page might be outdated.
See the recommended documentation of this function
xstringl
文字列を囲うボックスを計算
呼び出し手順
rect=xstringl(x,y,str,[fontId,fontSize])
引数
- rect
ボックスを定義する実数スカラーのベクトル.
- x,y
実数スカラー, 文字列の左下の点の座標.
- str
文字列の行列.
Scilab 5.2以降, LaTeX または MathML 式 を書くことができます.
- fontId
フォントの型を指定する整数.
- fontSize
フォントの大きさを指定する整数.
説明
xstringl は,
位置x,y (左下の点)にある文字列strを囲う
矩形の大きさをカレントのグラフィックスケールで
rect=[x,y,w,h](左下の点, 幅, 高さ)に返します.
ポストスクリプトドライバを使用する場合, この結果の近似精度は十分でない可能性があります.
例
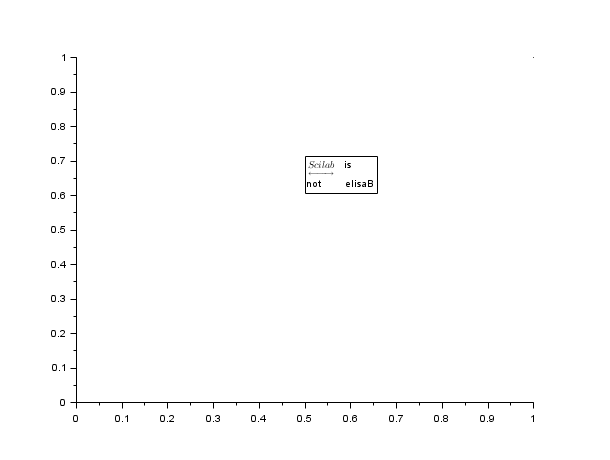
plot2d([0;1],[0;1],0)

str=["$\underleftrightarrow{Scilab}$" "is";"not" "elisaB"]; //  Scilab 5.2以降でのみ有効

r=xstringl(0.5,0.5,str)

xrects([r(1) r(2)+r(4) r(3) r(4)]')

xstring(r(1),r(2),str)

plot2d([0;1],[0;1],0)

str=["Scilab" "n''est ";"pas" "Matlab"];

r2 = xstringl(0.5,0.5,str,2,5)

xrects([r2(1) r2(2)+r2(4) r2(3) r2(4)]')

xstring(r2(1),r2(2),str)

txt2=gce();

txt2.font_size = 5;

txt2.font_style = 2;

plot2d([0;1],[0;1],0)

// Scilab 5.2以降でのみ有効

mathml="<mrow>      <mfrac>        <mrow>          <mi>d</mi>          <mi>y</mi>        </mrow>        <mrow>          <mi>d</mi>          <mi>x</mi>        </mrow>      </mfrac>      <mo>=</mo>      <mfrac>        <mn>1</mn>        <msup>          <mi>y</mi>          <mn>2</mn>        </msup>      </mfrac>    </mrow>";

a=gca();

a.margins=[0,0;0,0];

str=["SCILAB","can write LaTeX :","$\frac{abc}{xyz}$";"or","MathML :",mathml] ;

r2 = xstringl(0.5,0.5,str,2,5)

xrects([r2(1) r2(2)+r2(4) r2(3) r2(4)]')

xstring(r2(1),r2(2),str)

参照
| Report an issue | ||
| << xstringb | text | transform >> |