Please note that the recommended version of Scilab is 2026.1.0. This page might be outdated.
See the recommended documentation of this function
BARXY
y=f(x) animated viewer
Block Screenshot
Contents
Palette
Description
This block realizes the visualization of the evolution of the two regular input signals by drawing solid bars between two consecutive inputs representing x and y coordinates.
Dialog box
Xmin
Minimum value of the first input; used to set up the X-axis of the plot in the graphics window.
Properties: Type 'vec' of size 1
Xmax
Maximum value of the first input; used to set up the X-axis of the plot in the graphics window.
Properties: Type 'vec' of size 1
Ymin
Minimum value of the second input; used to set up the Y-axis of the plot in the graphics window.
Properties: Type 'vec' of size 1
Ymax
Maximum value of the second input; used to set up the Y-axis of the plot in the graphics window.
Properties : Type 'vec' of size 1
Segs Thickness
Thickness of segs that will be displayed.
Properties: Type 'vec' of size 1
Default properties
always active: no
direct-feedthrough: no
zero-crossing: no
mode: no
regular inputs:
- port 1 : size [-1, -1] / type 1 (must have at least a par sized vector of inputs).
- port 2 : size [-1, -1] / type 1 (must have at least a par sized vector of inputs).
number/sizes of activation inputs: 1
number/sizes of activation outputs: 0
continuous-time state: no
discrete-time state: no
object discrete-time state: no
name of computational function: BARXY_sim
Interfacing function
SCI/modules/scicos_blocks/macros/Sinks/BARXY.sci
Computational function
SCI/modules/scicos_blocks/macros/Sinks/BARXY_sim.sci (Type 5)
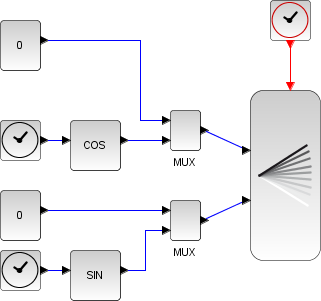
Animated bar viewer example
See also
| Report an issue | ||
| << AFFICH_m | Sinks palette | CANIMXY >> |