Please note that the recommended version of Scilab is 2026.0.1. This page might be outdated.
See the recommended documentation of this function
mesh
3D mesh plot
Syntax
mesh(Z)
mesh(X,Y,Z)
mesh(...,<GlobalProperty>)
mesh(...,<color>,<GlobalProperty>)
mesh(<axes_handle>,...)
Arguments
- Z
a real matrix defining the surface height. It can not be omitted. The
Zdata is am-by-nmatrix.- X, Y
two real matrices : always set together, these data defines a new standard grid. This new
XandYcomponents of the grid must matchZdimensions (see description below).- color
an optional real matrix defining a color value for each
(X(j),Y(i))point of the grid (see description below).- <GlobalProperty>
this optional argument represents a sequence of couple statements
{PropertyName,PropertyValue}that defines global objects' properties applied to all the curves created by this plot. For a complete view of the available properties (see GlobalProperty).- <axes_handle>
this optional argument forces the plot to appear inside the selected axes given by
axes_handlerather than the current axes (see gca).
Description
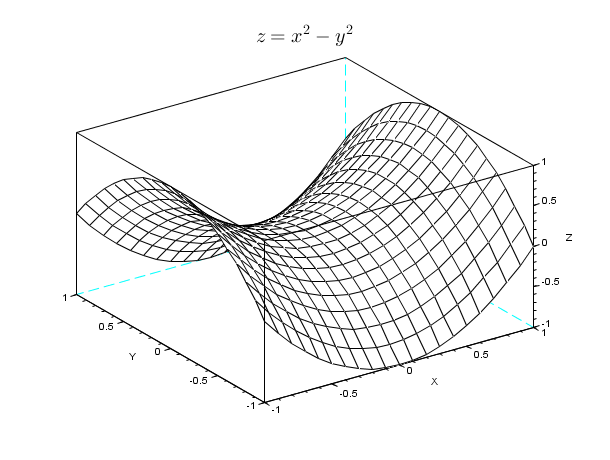
mesh draws a parametric surface using a rectangular grid
defined by X and Y coordinates (if
{X,Y} are not specified, this grid is determined using the
dimensions of the Z matrix); at each point of this grid, a z
coordinate is given using the Z matrix. mesh is
based on the surf command with default option
color_mode = white index (inside the current colormap) and
color_flag = 0.
Data entry specification :
In this paragraph and to be more clear, we won't mention
GlobalProperty optional arguments as they do not interfere
with entry data (except for "Xdata",
"Ydata" and "Zdata"
property, see GlobalProperty). It is
assumed that all those optional arguments could be present too.
If Z is the only matrix specified, mesh(Z)
plots the matrix Z versus the grid defined by
1:size(Z,2) along the x axis and 1:size(Z,1)
along the y axis.
Remarks
To enable the transparency mode you should set the
color_mode option to 0.
See also
- surf — 3D surface plot
- meshgrid — create matrices or 3-D arrays
- plot2d — 2D plot
- LineSpec — to quickly customize the lines appearance in a plot
- GlobalProperty — to customize the objects appearance (curves, surfaces...) in a plot or surf command
| Report an issue | ||
| << hist3d | 3d_plot | nf3d >> |
