Please note that the recommended version of Scilab is 2026.1.0. This page might be outdated.
See the recommended documentation of this function
color
returns the color id of a color
Syntax
id=color(name)
id=color(r,g,b)
Arguments
- name
name of a color.
- r,g,b
RGB integer values of a color.
- id
id of the color.
Description
color returns the color id corresponding to its argument:
namemust be the name of a known color (see color_list).r,gandbmust be integers between 0 and 255 corresponding to colors components red, green and blue. As usual 0 means no intensity and 255 means all the intensity of the color.
If the requested color does not exist in the current colormap it is added to the colormap. If no window exists, the color is added to the default figure colormap.
This function can be used to specify the foreground or background colors when plotting.
Examples
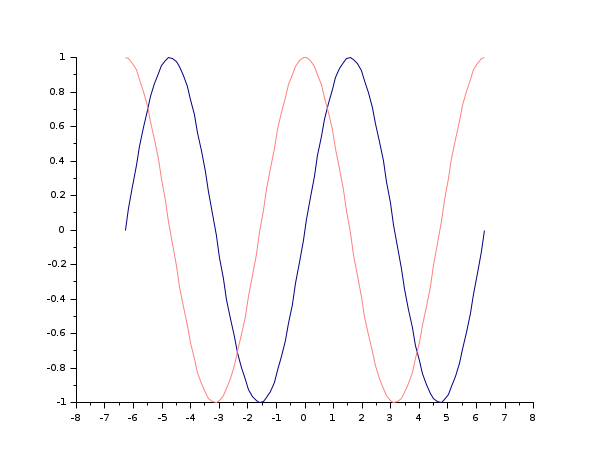
x=linspace(-2*%pi,2*%pi,100)';
// using existing colors
plot2d(x,[sin(x),cos(x)],style=[color("red"),color("green")]);
// new colors: there are added to the colormap
e=gce(); p1=e.children(1); p2=e.children(2);
p1.foreground=color("purple"); p2.foreground=color("navy blue");
// using RGV values
p1.foreground=color(255,128,128);
See also
- colormap — using colormaps
- color_list — list of named colors
- getcolor — opens a dialog to show colors in the current colormap
| Report an issue | ||
| << addcolor | color_management | color_list >> |