Please note that the recommended version of Scilab is 2026.0.1. This page might be outdated.
See the recommended documentation of this function
Math rendering in Scilab graphics
LaTeX またはMathML言語によりScilabグラフィックスで数式を表示する.
使用方法
Scilab 5.2以降, LaTeX または MathML式を記述することが可能です.
LaTeX テキストは先頭を末尾を $ (ドル記号) とし, MathMLは< で開始し, >で終了すること,また文法的に正しいことが必要です.
初回の使用の際,MathMLエンジンの起動はLaTeXよりも時間がかかります. (これらのライブラリは必要な時にオンザフライで読み込まれます)
// LaTeX / MathML目盛の例:
plot2d();
a=gca();

mathml="<mrow><mfrac><mrow><mi>d</mi><mi>y</mi></mrow><mrow><mi>d</mi><mi>x</mi></mrow></mfrac><mo>=</mo><mfrac>" + ..
"<mn>1</mn><msup><mi>y</mi><mn>2</mn></msup></mfrac></mrow>";
// LaTeX/MathML式の混用
a.x_ticks = tlist(["ticks", "locations", "labels"], (0:6)', [mathml;"1";"$\sin(x)$";"3";"$\cos(a) - test$";"5";"6"]);
LaTeXに関する説明
レンダリングエンジンはJavaライブラリJLaTeXMathに基づいています.
JLaTeXMathはLaTeXの数式モードの実装の一つです.
全てのLaTeXのコマンドを処理することができます(欠けている場合には
バグレポートを遠慮なく投稿してください).
逆に, \over のようなTeX コマンドはサポートされていません.
Scilab 5.2.1以降, ギリシャ文字, キリル文字およびラテンアルファベット文字に 関する完全な Unicode が Scilabグラフィックスで処理されます.

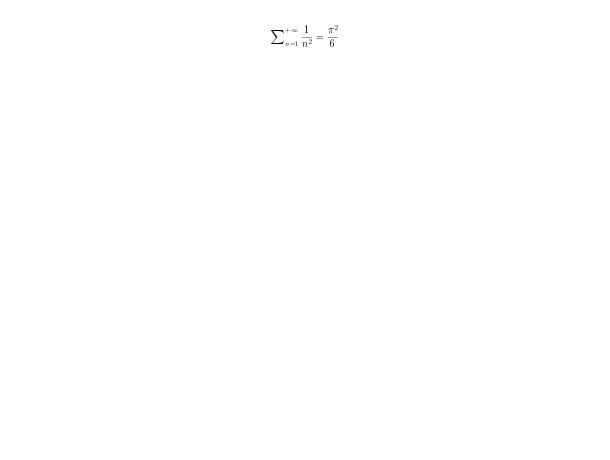
xtitle('$\textstyle\sum_{n=1}^{+\infty}\frac1{n^2}=\frac{\pi^2}{6}$')
xtitle('$\big(\bigg)$')
xtitle('$\mbox{Vector field for }\ddot{\theta}=\sin\theta$')
xtitle('$\JLaTeXMath\ \mathfrak{and}\ \mathtt{Scilab}$')
xstring(0.5,0.5,"$\overbrace{привет\ мир} \underbrace{γειά\ κόσμο}$")
JLaTeXMath では以下のコマンドにより複数のフォントを
指定することができます:
\mathbb, \mathscr,
\mathcal, \mathbf,
\mathit, \mathsf,
\mathtt, \mathfrak,
\mathds, \mathrm,
コマンド\boldsymbolを付けることにより,
ボールド体を指定することが可能です:
xtitle('$\mathbb{SCILAB}\ \mathsf{or}\ \boldsymbol{\mathfrak{Scilab}}$')
xtitle('$\mathscr{C}\mbox{ n''est pas }\boldsymbol{\mathcal{C}}$')
以下のLaTeXパッケージが利用可能です: amsmath, amssymb, stmaryrd, amsxtra およびgraphicsのいくつかのコマンドをサポートする accents. これらのパッケージのコマンドのほとんどが使用可能です (例えば,amsmathのいくつかのコマンドは利用できません).
xtitle('$\sideset{_\alpha^\beta}{_\gamma^\delta}\prod$')
xtitle('$\hat{\accentset{\star}{\hat h}}\undertilde{ABC}$')
xtitle('$\begin{pmatrix}\mathfrak{a}&\alpha\\\mathbb{A}&\mathcal{A}\end{pmatrix}\mbox{ or }..
\begin{bmatrix}\mathfrak{a}&\alpha\\\mathbb{A}&\mathcal{A}\end{bmatrix}$')
xstring(0.5,0.5,'$\left(\frac{\pi}{\sqrt[3]{2}}\middle|\sqrt{\frac{1+\frac1x}{x}}\right\rangle$')
xtitle('$\doublecup\ddag\fatbslash\lll\oplus\ovee\circledcirc\circlearrowright$')
xtitle('$\rotatebox{180}{\boxed{\JLaTeXMath}}\ \reflectbox{\JLaTeXMath}$')
xtitle('$\scalebox{0.6}{\sum_{n=1}^{+\infty}\frac1{n^2}=\frac{\pi^2}6}$')
xtitle('$\fcolorbox{black}{Tan}{\JLaTeXMath}$')
xtitle('$\textcolor{Magenta}{\mathfrak{Scilab}}\mbox{ and }\textcolor{Green}{\mathcal{SCILAB}}$')
以下のように新しいコマンドや環境を定義することも可能です:
MathML に関する説明
MathML レンダリングは Jeuclidに基づいています. Jeuclid は MathML 実装の一つで,仕様全体をカバーしています. これにより、 MathML言語の全てが Scilabによりサポートされます.
Jeuclid ライブラリの大きさのため, 初回の使用時にロードに数秒かかります. しかし,次回以降は高速化されます.

plot3d();
a=get("current_axes");
a.x_label.font_size= 5;
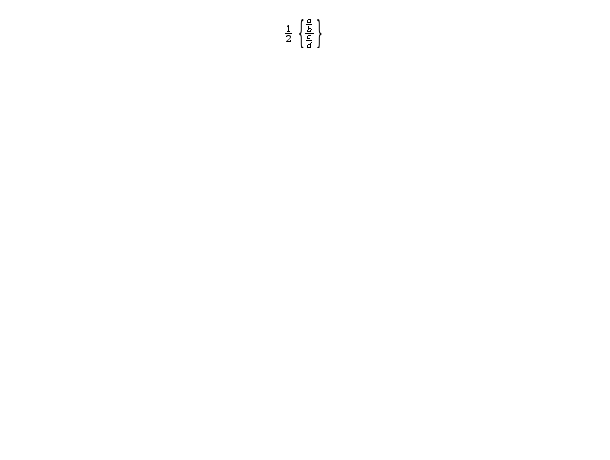
a.x_label.text="<mrow><mfrac><mrow><mn>1</mn></mrow><mrow><mn>2</mn></mrow></mfrac><mo></mo><mfenced open=""{"" close=""}"">" + ..
"<mrow><mfrac><mrow><mfrac><mrow><mi>a</mi></mrow><mrow><mi>b</mi></mrow></mfrac></mrow><mrow><mfrac><mrow>" + ..
"<mi>c</mi></mrow><mrow><mi>d</mi></mrow></mfrac></mrow></mfrac></mrow></mfenced></mrow>"
参照
- xtitle — グラフィックスウインドにタイトルを追加する
- axes_properties — axesエンティティプロパティの説明
- label_properties — Labelエンティティプロパティの説明
- legend_properties — Legend エンティティプロパティの説明.
- text_properties — Textエンティティプロパティの説明
- xstringb — 文字列をボックス内に描画
- xstringl — 文字列を囲うボックスを計算
- xstring — 文字列を描画
- uicontrol — グラフィックユーザーインターフェイスオブジェクトを作成
- uimenu — 図にメニューまたはサブメニューを作成する
| Report an issue | ||
| << graphics_fonts | text | stringbox >> |