Please note that the recommended version of Scilab is 2026.1.0. This page might be outdated.
See the recommended documentation of this function
bar
棒ヒストグラム
呼び出し手順
bar(y)

bar(x,y)

bar([h],x,y [,width [,color [,style]]])
引数
- h
axes ハンドル, (デフォルト: h=gca() ).
- y
実数スカラー, 大きさ Nのベクトル, または N*M行列.
- x
実数スカラー, 大きさ Nのベクトル, (デフォルト: y がベクトルの場合, x はベクトルで xの長さはyの長さに等しくなります. yが行列の場合,xはベクトルとなりxの長さはyの行数と等しくなります.
- width
(オプション), 実数スカラー, bar の幅 (利用可能な空間の割合) を定義 (デフォルト: 0.8, すなわち 80%).
- color
(オプション), 文字列 (デフォルト: 'blue'), カラーバーの内側の色を指定.
- style:
文字列, 'grouped' または 'stacked' (デフォルト: 'grouped').
説明
bar(y,...) : y がベクトルの場合, bar 関数は
polyline_style 6型を有するポリラインを描画します.
y がベクトルの場合, bar はベクトルyをベクトル1:size(y,'*')に対して
描画します. y が行列 N*M の場合, bar は M個のポリライン(6型)を描画し,
各ポリラインはyの列に対してベクトルx=1:size(y,1)に対応します.
bar(x,y,...) : yがベクトルの場合, bar 関数は
polyline_style 6型 を有するポリラインを描画します.
ただし, xの長さ = yの長さとなります.
y が行列 NxMの場合, bar 関数は6型 を有するM本のポリラインを描画します.
各ポリラインはyの列に対するベクトルxに対応します.
bar(h,...) : は描画を実行中のカレントの軸を定義します.
bar(...,width,...) : は棒の幅をパーセント単位で
定義します(通常: 0<width<=1).
bar(...,style,...) : は棒の描画方法を定義します.
y が行列 N*M の場合 (つまり, M本の6型ポリライン),
M個の棒を描画する方法が二種類あります.
styleオプション = 'grouped'により,
M個のポリラインをxの各要素に対して中心に置くことができます,
そして, style オプション 'stacked' によりこれらをスタックすることができます.
bar(...,color,...) :は,barの色を定義します.
bar関数はplot関数と同じカラーマップを使用します.
barを複数回コールする場合,
barhomogenize関数により
カレントの軸に含まれる
全ての棒(すなわち,6型のポリライン)の幅とスタイルを統一できます.
例
例
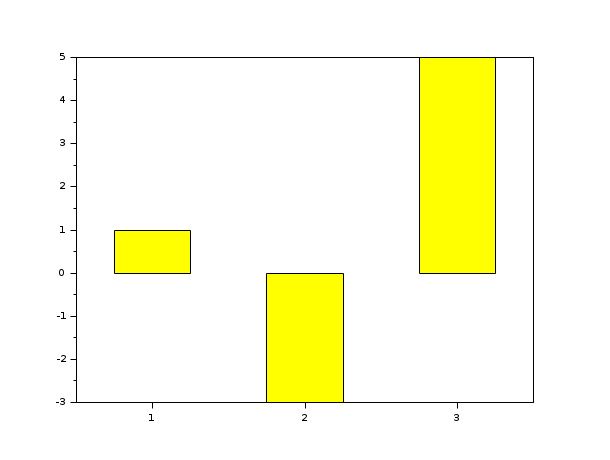
// 最初の例: 棒を描画 (すなわち,polyline_style type =6のポリライン) ただし,

// width=0.5 , color='yellow' で default style='grouped', x=1:length(y).

scf(0);

y=[1 -3 5];

bar(y,0.5,'yellow');
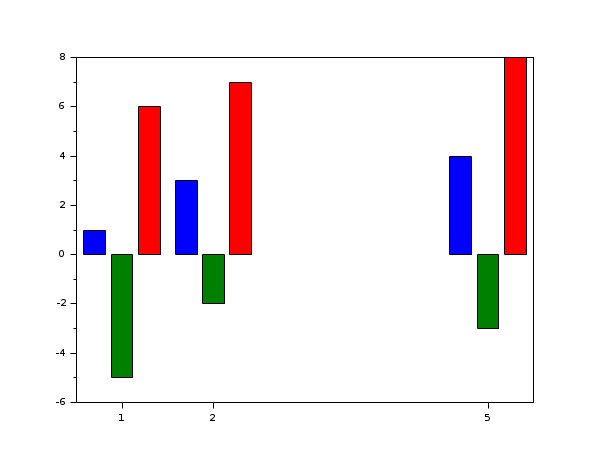
// 2番目の例: 棒を 3 つ描画 (すなわち,polyline_style type =6の3個のポリライン),default style='grouped'

scf(1);

x=[1 2 5]; y=[1  -5 6;3 -2 7;4  -3 8];

bar(x,y);
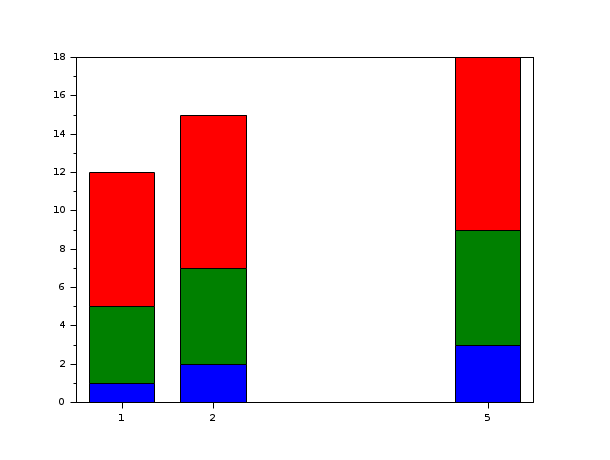
// 3番目の例 : style='stacked'.

scf(2);

x=[1 2 5]; y=[1 4 7;2 5 8;3 6  9];

bar(x,y,'stacked');
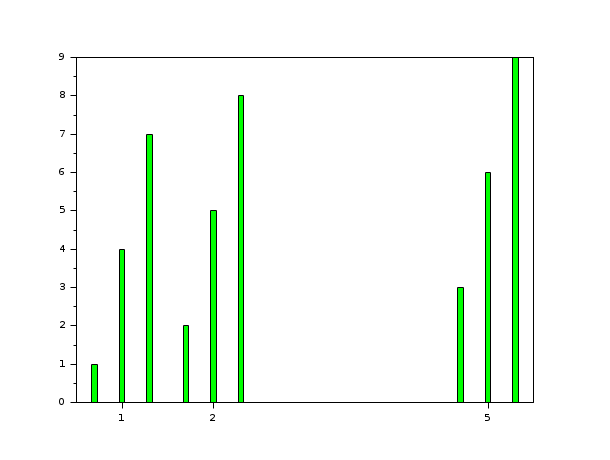
// 4番目の例: width=0.2;color='green'; default style='grouped'

scf(3);

x=[1 2 5]; y=[1 4 7;2 5 8;3 6 9];

bar(x,y,0.2,'green');
参照
- barh — 棒ヒストグラムの水平表示
- barhomogenize — カレントの軸に含まれる棒グラフを均質化する
- plot — 2Dプロット
- histplot — ヒストグラムをプロットする
- polyline_properties — Polylineエンティティプロパティの説明
| Report an issue | ||
| << bar_histogram | bar_histogram | barh >> |