Scilab 5.5.2
Please note that the recommended version of Scilab is 2026.1.0. This page might be outdated.
See the recommended documentation of this function
xstringb
draw strings into a box
Calling Sequence
xstringb(x,y,str,w,h,[option])
Arguments
- x,y,w,h
vector of 4 real scalars defining the box.
- str
matrix of strings.
Starting from Scilab 5.2, it is possible to write LaTeX or MathML expression.
- option
string.
Description
xstringb draws the matrix of strings str centered inside
the rectangle rect=[x,y,w,h]
(lower-left point, width, height) in user coordinates.
If option is given with the value "fill", the character size is
computed so as to fill as much as possible in the rectangle.
Enter the command xstringb() to see a demo.
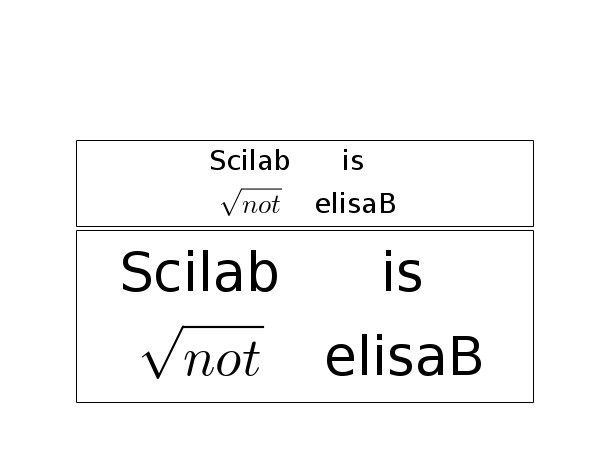
Examples
str=["Scilab" "is";"$\sqrt{not}$" "elisaB"];
plot2d(0,0,[-1,1],"010"," ",[0,0,1,1]);

r=[0,0,1,0.5];
xstringb(r(1),r(2),str,r(3),r(4),"fill");
xrect(r(1),r(2)+r(4),r(3),r(4));

r=[r(1),r(2)+r(4)+0.01,r(3),r(4)/2];
xrect(r(1),r(2)+r(4),r(3),r(4))
xstringb(r(1),r(2),str,r(3),r(4),"fill");
See Also
| Report an issue | ||
| << xstring | text | xstringl >> |