Scilab 5.5.2
Please note that the recommended version of Scilab is 2026.1.0. This page might be outdated.
See the recommended documentation of this function
xpoly
draw a polyline or a polygon
Calling Sequence
xpoly(xv,yv [,dtype [,close]])
Arguments
- xv,yv
matrices of the same size (points of the polyline).
- dtype
string (drawing style). default value is "lines".
- close
integer. If close=1, the polyline is closed; default value is 0.
Description
xpoly draws a single polyline described by the vectors of
coordinates xv and yv. If xv and
yv are matrices they are considered as vectors by
concatenating their columns. dtype can be
"lines" for using the current line style or
"marks" for using the current mark to draw the polyline.
Examples
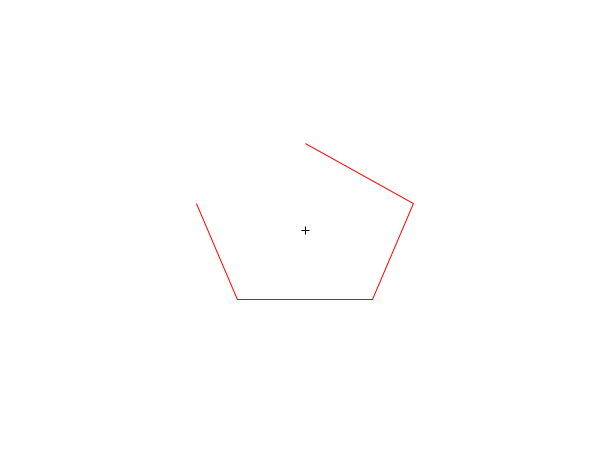
x=sin(2*%pi*(0:4)/5);
y=cos(2*%pi*(0:4)/5);

plot2d(0,0,-1,"010"," ",[-2,-2,2,2])
xpoly(x,y,"lines") // by default closed
e=gce(); // get the current entity (the last created: here the polyline)
set(e,"foreground",5);

e.closed = 'off' // the polyline is now open
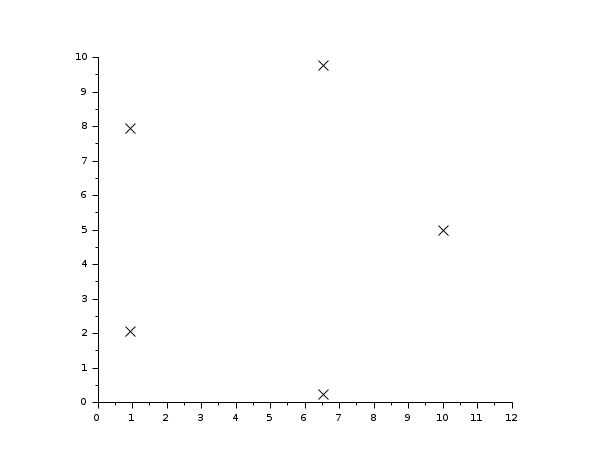
// With marks instead of lines
plot2d(0,0,1,rect=[0,0,12,10], frameflag=3)
t=[0:4]*2*%pi/5;
x=5+5*cos(t);
y=5+5*sin(t);
xpoly(x,y,"marks")
e=gce();
set(e,"mark_style",2);
See Also
- xfpoly — fill a polygon
- xfpolys — fill a set of polygons
- xpolys — draw a set of polylines or polygons
- polyline_properties — description of the Polyline entity properties
| Report an issue | ||
| << xfpolys | polygon | xpolys >> |