Please note that the recommended version of Scilab is 2026.1.0. This page might be outdated.
See the recommended documentation of this function
polyline properties
description of the Polyline entity properties
Description
The Polyline entity is a leaf of the graphics entities hierarchy. This entity defines the parameters for polylines.
- parent:
This field contains the handle of the parent. The parent of the polyline entity should be of the type
"Axes"or"Compound".- children:
This property contains a vector with the
childrenof the handle. However, polyline handles currently do not have anychildren.- visible:
This field contains the
visibleproperty value for the entity . It should be"on"or"off". By default, the polyline is visible, the value's property is"on". If"off"the polyline is not drawn on the screen.- data:
This field contains the values for the x and y coordinates. Component Z is to be added in the case of three-dimensional axes. It is a two (three) column matrix
[x,y,[z]]of points.- closed:
This field determines wether the polyline is closed or not: its value can be
"on"or"off"(no default value, it depends on the primitive used to create the polyline).- line_mode:
This field contains the default
line_modeproperty value for the polyline. Its value should be"on"(line drawn) or"off"(no line drawn).- fill_mode:
If the
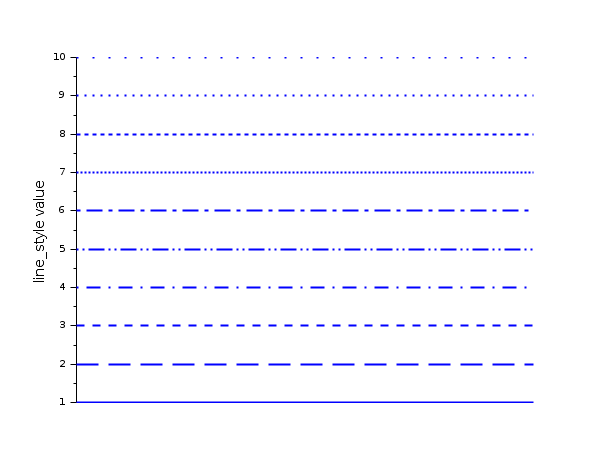
polyline_stylefield is different of 5, fill the background of the curve with color defined by thebackgroundproperty.- line_style:
This field contains the default
line_styleproperty value for Segs, Arcs, Rectangle and Polyline objects.line_styleselects the type of line to be used to draw lines . Its value should be an integer in [1 10]. 1 stand for solid, the other values stand for a selection of dashes (dash, dash dot, longdash dot, bigdash dot, bigdash longdash, dot, double dot, longblank dot, bigblank dot). See example below.- thickness:
This property is a positive real specifying the line width in pixels. The displayed width is actually determined by rounding the supplied width to the nearest integer. The only exception is vectorial export where the whole
thicknessvalue is considered.- arrow_size_factor:
This integer allows to set the size of arrows drawn on the polyline. The actual size of arrows is the product of the
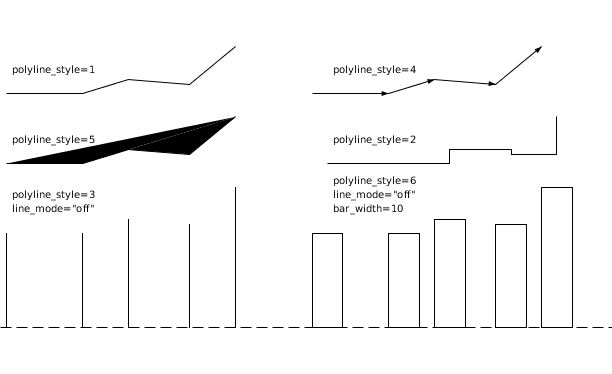
thicknessand the size factor.- polyline_style:
This property sets several polyline drawing mode:
If the value is 0 or 1 lines are drawn between two consecutives points.
If the value is 2 the polyline produces a staircase plot. Two consecutives points are linked by a horizontal line followed by a vertical line.
If the value is 3 the polyline produces a bar plot. For each given point (x,y) a vertical line is drawn from (x,y) to (x,0).
If the value is 4 arrows are drawn between two consecutives points.
If the value is 5 the polyline is filled (patch).
If the value is 6 the polyline is a Matlab-like bar object. The properties
bar_shiftandbar_widthcommand its appearance.
- foreground:
This field contains the default
foregroundproperty used to draw the polyline. Its value should be a color index (relative to the current colormap).- background:
This field contains the color used to fill the background of the polyline. Its value should be a color index (relative to the current colormap).
- interp_color_vector:
This field contains the vector of color indices used to fill in the polyline when the
interp_color_modeproperty is set to"on". It defines the intervals of colormap indices used to fill each segment. For instance, the first segment will be filled by every colors whose index is between the first two elements of the vector. It is only applicable if the polyline is defined by 3 or 4 points. Therefore, the size of the vector must match this dimension.- interp_color_mode:
This field determines if we are using the interpolated shading mode to fill the polyline : its value can be
"on"or"off". Note that aninterp_color_vectormust be defined before switching to "on" value (see above).- mark_mode:
This field contains the default
mark_modeproperty value for the polyline. Its value should be"on"(marks drawn) or"off"(no marks drawn).- mark_style:
The
mark_styleproperty value is used to select the type of mark to use whenmark_modeproperty is"on". The value should be an integer in [0 14] which stands for: dot, plus, cross, star, filled diamond, diamond, triangle up, triangle down, diamond plus, circle, asterisk, square, triangle right, triangle left and pentagram. The figure below shows the aspects of the marks depending on themark_styleand themark_foregroundandmark_backgroundproperties.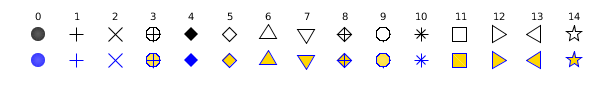
- mark_size_unit:
This field contains the default
mark_size_unitproperty value. Ifmark_size_unitis set to"point", then themark_sizevalue is directly given in points. Whenmark_size_unitis set to"tabulated",mark_sizeis computed relative to the font size array: therefore, its value should be an integer in [0 5] which stands for 8pt, 10pt, 12pt, 14pt, 18pt and 24pt. Note that plot2d and pure scilab functions usetabulatedmode as default ; when using plot function, thepointmode is automatically enabled.- mark_size:
The
mark_sizeproperty is used to select the type of size of the marks whenmark_modeproperty is"on". Its value should be an integer between 0 and 5 whith stands for 8pt, 10pt, 12pt, 14pt, 18pt and 24pt.- mark_foreground:
This field contains the
mark_foregroundproperty value which is the marks' edge color. Its value should be a color index (relative to the current color_map) or 0 for transparant edge.- mark_background:
This field contains the
mark_backgroundproperty value which is the marks' face color. Its value should be a color index (relative to the current color_map) or 0 for transparant face.- mark_offset:
This field contains the
mark_offsetproperty value which is the offset to use to draw the first mark. Its value should be an integer greater or equal to 0 (default value is 0).- mark_stride:
This field contains the
mark_strideproperty value which is the stride to use to draw the marks (i.e. stride-1 points are skipped between two consecutive marks). Its value should be integer greater or equal to 1 (default value is 1).- x_shift:
This field contains the offset computed by a call to the bar function (or re-computed by a call to barhomogenize) and is used to perform a nice vertical bar representation. Note that this offset is also taken into account for all the other
polyline_style. The unit is expressed in user coordinates.- y_shift:
This field contains the offset computed by a call to the bar function (or re-computed by a call to barhomogenize) and is used to perform a nice horizontal bar representation. Note that this offset is also taken into account for all the other
polyline_style. The unit is expressed in user coordinates.- z_shift:
This field contains the offset the user may specify. Note that this offset is taken into account for all the
polyline_style. The unit is expressed in user coordinates.- bar_width:
This field determines the width of the selected polyline when its
polyline_styleis set to bar mode (case 6) : the unit is expressed in user coordinates.- clip_state:
This field contains the
clip_stateproperty value for the polyline. It should be :"off"this means that the polyline is not clipped."clipgrf"this means that the polyline is clipped outside the Axes box."on"this means that the polyline is clipped outside the rectangle given by property clip_box.
- clip_box:
This field is to determinate the
clip_boxproperty. By Default its value should be an empty matrix if clip_state is "off". Other cases the vector[x,y,w,h](upper-left point width height) defines the portions of the polyline to display, howeverclip_stateproperty value will be changed.- user_data:
This field can be use to store any scilab variable in the polyline data structure, and to retrieve it.
- datatips:
This property contains a vector of the
datatipshandles related to the polyline. However, polyline handles currently do not have anychildren.- display_function:
A character string that contains a function name. This function calling sequence must be
str=fun(datatipHandle)wheredatatipHandleis the handle of the datatip to be displayed. This function must return a string or a vector of strings in str.This function can be overloaded by setting the similar property on a datatip itself.
- display_function_data:
Any Scilab data needed by the
display_functionfunction.
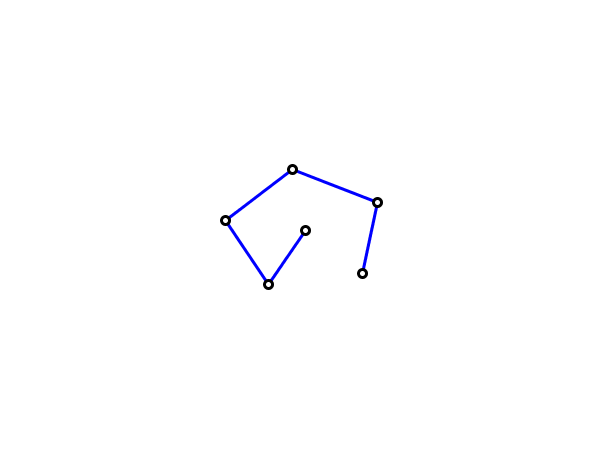
Examples
a=get("current_axes")//get the handle of the newly created axes
a.data_bounds=[-2,-2;2,2];

xpoly(sin(2*%pi*(0:5)/5),cos(2*%pi*(0:5)/5),"lines",0)
p=get("hdl"); //get handle on current entity (here the polyline entity)
p.foreground=2;
p.thickness=3;
p.mark_style=9;
d=p.data;d(1,:)=[0 0];p.data=d;
a.rotation_angles=[0 45];
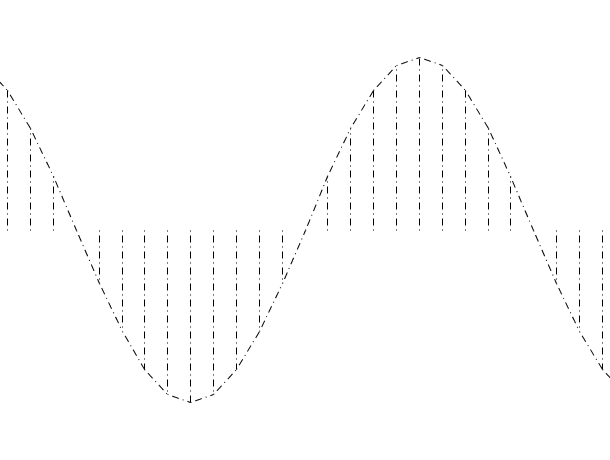
xpoly(sin(2*%pi*(0:5)/5),cos(2*%pi*(0:5)/5),"lines",0)
p=get("hdl"); //get handle on current entity (here the polyline entity)
p.data=[(-2:0.1:2)' sin((-2:0.1:2)*%pi)']
p.mark_mode="off";
p.polyline_style=3;
p.line_style=4;
// Example for line_style property
clf();
f=gcf();
for i=1:10
    plot2d(1:10, i*ones([1:10]), 2);
    // Change line_style:
    f.children.children(1).children.line_style = i;
    f.children.children(1).children.thickness = 2;
end
f.children.axes_visible = ["off","on","off"];
f.children.y_label.text = "line_style value";
f.children.y_label.font_size = 3;
See Also
- set — set a property value of a graphic entity object or of a User Interface object.
- get — Retrieve a property value from a graphics entity or an User Interface object.
- delete — delete a graphic entity and its children.
- xpoly — draw a polyline or a polygon
- xfpoly — fill a polygon
- xpolys — draw a set of polylines or polygons
- xfpolys — fill a set of polygons
- graphics_entities — описание структур данных графических объектов
History
| Версия | Описание |
| 5.4.0 | line_style value 0 is obsolete, use 1 instead (both are equivalent for SOLID). Using value 0 will produce an error in Scilab 5.4.1. |
| Report an issue | ||
| << polygon | polygon | xfpoly >> |