- Scilab Help
- Graphics
- 2d_plot
- LineSpec
- Matplot
- Matplot1
- Matplot properties
- Sfgrayplot
- Sgrayplot
- champ
- champ1
- champ properties
- comet
- contour2d
- contour2di
- contourf
- errbar
- fchamp
- fcontour2d
- fec
- fec properties
- fgrayplot
- fplot2d
- grayplot
- grayplot properties
- graypolarplot
- histplot
- paramfplot2d
- plot
- plot2d
- plot2d1
- plot2d2
- plot2d3
- plot2d4
- polarplot
Please note that the recommended version of Scilab is 2026.1.0. This page might be outdated.
See the recommended documentation of this function
fec
pseudo-color plot of a function defined on a triangular mesh
Calling Sequence
fec(x,y,triangles,func,<opt_args>)
fec(x,y,triangles,func,[strf,leg,rect,nax,zminmax,colminmax,colout,mesh])
Arguments
- x,y
two vectors of size
n,(x(i),y(i))gives the coordinates of nodei- func
a vector of size
n:func(i)gives the value at nodeiof the function for which we want the pseudo-color plot.- triangles
is a
[Ntr,5]matrix. Each line oftrianglesspecifies a triangle of the meshtriangle(j) = [number,node1,node2,node3,flag].node1,node2,node3are the number of the nodes which constitutes the triangle. number is the number of the triangle and flag is an integer not used in the fec function- <opt_args>
This represents a sequence of statements
key1=value1, key2=value2,... wherekey1,key2,...can be one of the following: strf, leg, rect, nax, zminmax, colminmax, colout, mesh (see plot2d for the 4 first ones).- strf,leg,rect,nax
see plot2d
- zminmax
vector with 2 components [zmin zmax] (useful in particular for animation)
- colminmax
vector of 2 positives integers [colmin colmax]
- colout
vector of 2 integers [under_min_col upper_max_col]
- mesh
boolean scalar, default value %f (must be true if you want also display the mesh)
Description
This function is the good one to draw linear triangular finite element solutions or simply to display a function defined on a triangulation. The color interpolation is done through software computation and so it is not too fast.
The function colorbar may be used to see the color scale (see the example section).
The zminmax argument gives the z values associated with the first and the last
color (of the current colormap). More exactly if the colormap have nc colors and if we note
dz = (zmax-zmin)/nc, then the part of the triangulation where
zmin + (i-1)dz <= z < zmin + i dz is filled with the color i).
By default zmin = min(func) and zmax = max(func). If you want to do
an animation with func values that varie in time, take for zmin and zmax the global
minimum and maximum or something close.
The colout argument lets the user choosing the colors for the 2 extremes
regions {func < zmin} and {func > zmax}, under_min_col and
upper_max_col may be equal (independantly) to:
- -1
in this case the same color than in the neighbouring zone is used (CAUTION: you do not see that the corresponding limit is crossed), this is the default case.
- 0
in this case the extreme region is not painting at all.
- k
(k being a valid index to a color of the current colormap) the extreme region is painting in color k.
If you do not want to use the complete colormap you may use the colminmax
argument with 1 <= colmin < colmax <= nc (nc being the number of colors
of the current colormap) so as to use only the [colmin,colmax] sub-part of the colormap.
(by default all the colors of the colormap are used).
See the demo files demos/fec:
fec.ex1 is a simple demo file in which a mesh and a function
on that mesh is completely built in Scilab syntax
fec.ex2 is an example for which the mesh and the function value where
computed by an external mesh builder (amdba type mesh) and an external program.
A set of macros ( provided in file macros.sci) can be used to read the
data files in Scilab and plot the results.
Examples
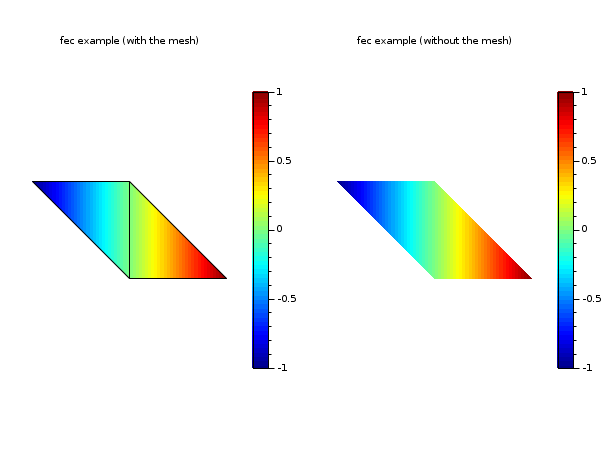
// define a mini triangulation (4 vertices, 2 triangles)
x = [0 1 0 -1];
y = [0 0 1  1];
T = [1 1 2 3 1;
     2 3 4 1 1];
z = [0 1 0 -1];  // values of the func at each vertices
clf()
xset("colormap",jetcolormap(64))
subplot(1,2,1)
  colorbar(-1,1)
  fec(x,y,T,z,strf="040",mesh=%t)
  xtitle("fec example (with the mesh)")
subplot(1,2,2)
  colorbar(-1,1)
  fec(x,y,T,z,strf="040")  // rmq: mesh=%f by default
  xtitle("fec example (without the mesh)")
show_window()
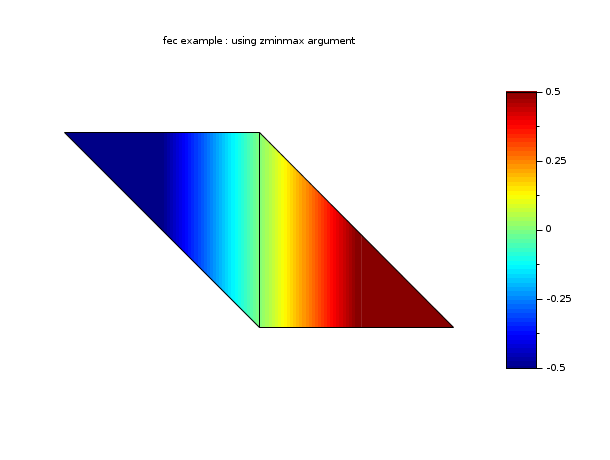
// define a mini triangulation (4 vertices, 2 triangles)
x = [0 1 0 -1];
y = [0 0 1  1];
T = [1 1 2 3 1;
     2 3 4 1 1];
z = [0 1 0 -1];  // values of the func at each vertices
// this example shows the effect of zminmax and uses the
// previous example data (you have to execute the it before)
clf()
xset("colormap",jetcolormap(64))
colorbar(-0.5,0.5)  // be careful colorbar must be set by hands !
fec(x,y,T,z,strf="040", zminmax=[-0.5 0.5], mesh=%t)
xtitle("fec example : using zminmax argument")
show_window()
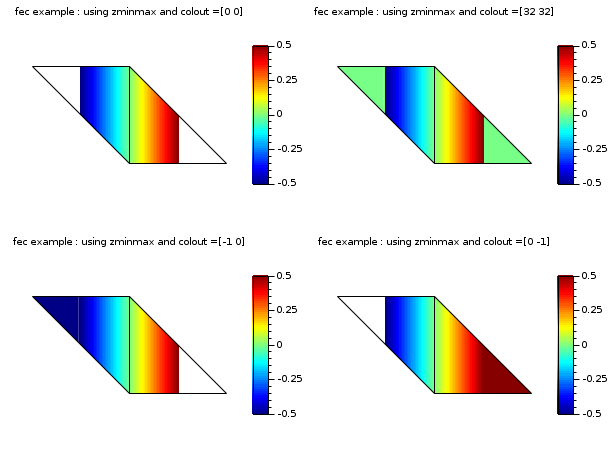
// define a mini triangulation (4 vertices, 2 triangles)
x = [0 1 0 -1];
y = [0 0 1  1];
T = [1 1 2 3 1;
     2 3 4 1 1];
z = [0 1 0 -1];  // values of the func at each vertices
// this example shows the effect of zminmax and colout. It uses
// also the data of the first example (you have to execute the it before)
clf()
xset("colormap",jetcolormap(64))
subplot(2,2,1)
  colorbar(-0.5,0.5)
  fec(x,y,T,z,strf="040", zminmax=[-0.5 0.5], colout=[0 0], mesh=%t)
  xtitle("fec example : using zminmax and colout =[0 0]")
subplot(2,2,2)
  colorbar(-0.5,0.5)
  fec(x,y,T,z,strf="040", zminmax=[-0.5 0.5], colout=[32 32], mesh=%t)
  xtitle("fec example : using zminmax and colout =[32 32]")
subplot(2,2,3)
  colorbar(-0.5,0.5)
  fec(x,y,T,z,strf="040", zminmax=[-0.5 0.5], colout=[-1 0], mesh=%t)
  xtitle("fec example : using zminmax and colout =[-1 0]")
subplot(2,2,4)
  colorbar(-0.5,0.5)
  fec(x,y,T,z,strf="040", zminmax=[-0.5 0.5], colout=[0 -1], mesh=%t)
  xtitle("fec example : using zminmax and colout =[0 -1]")
show_window()
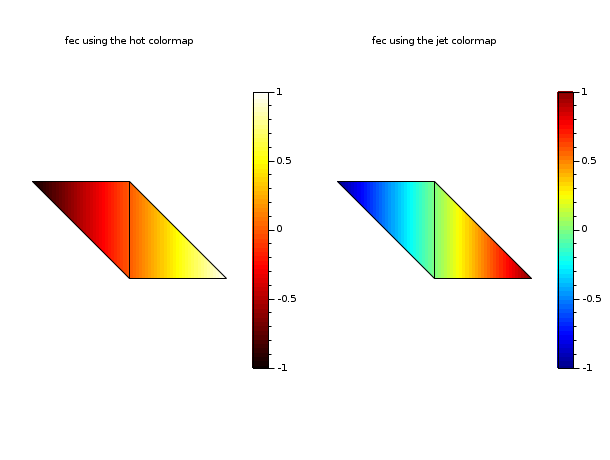
// define a mini triangulation (4 vertices, 2 triangles)
x = [0 1 0 -1];
y = [0 0 1  1];
T = [1 1 2 3 1;
     2 3 4 1 1];
z = [0 1 0 -1];  // values of the func at each vertices

// this example shows a feature from colminmax:
// playing with 2 colormaps for 2 subplots. It
// uses also the data of the first example.
clf()
xset("colormap",[hotcolormap(64);jetcolormap(64)])
subplot(1,2,1)
  colorbar(-1,1,[1 64])
  fec(x,y,T,z,strf="040", colminmax=[1 64], mesh=%t)
  xtitle("fec using the hot colormap")
subplot(1,2,2)
  colorbar(-1,1,[65 128])
  fec(x,y,T,z,strf="040", colminmax=[65 128], mesh=%t)
  xtitle("fec using the jet colormap")
show_window()
See Also
- colorbar — draw a colorbar
- Sfgrayplot — smooth 2D plot of a surface defined by a function using colors
- Sgrayplot — smooth 2D plot of a surface using colors
| Report an issue | ||
| << fcontour2d | 2d_plot | fec properties >> |