- Scilab Help
- Graphics
- 2d_plot
- 3d_plot
- annotation
- axes_operations
- axis
- bar_histogram
- Color management
- Datatips
- figure_operations
- geometric_shapes
- handle
- interaction
- lighting
- load_save
- pie
- polygon
- property
- text
- transform
- window_control
- GlobalProperty
- Graphics: Getting started
- Compound properties
- Graphics Entities
- object editor
- pixel_drawing_mode
- Segments properties
- twinkle
- xchange
- xclear
- xdel
- xget
- xgetech
- xgraduate
- xgrid
- xname
- xnumb
- xpause
- xsegs
- xset
- xsetech
- xsetm
Please note that the recommended version of Scilab is 2026.1.0. This page might be outdated.
See the recommended documentation of this function
Graphics: Getting started
graphics library overview
2d plotting
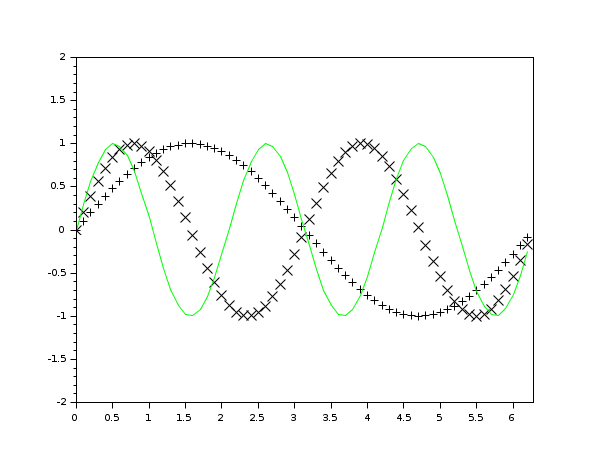
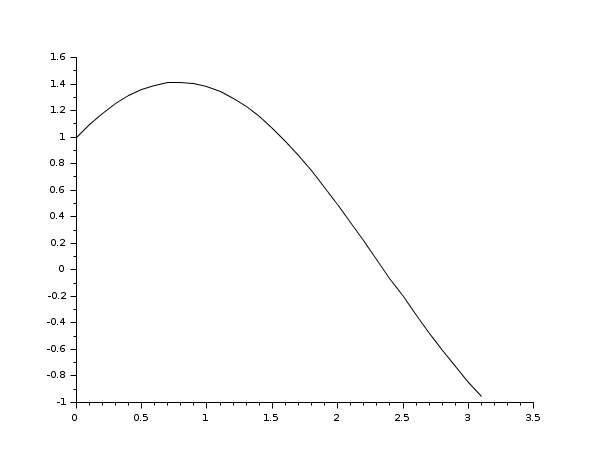
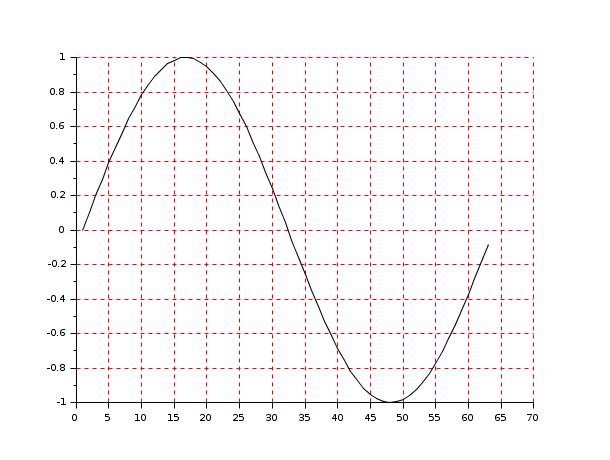
- plot2d
Plot a curve
Example:
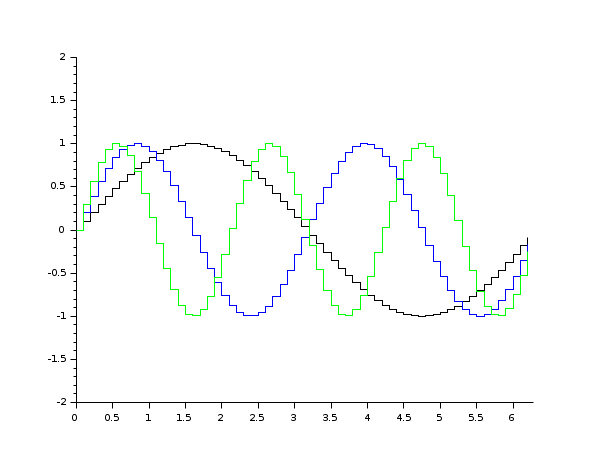
- plot2d2
Plot a curve as step function
Example:
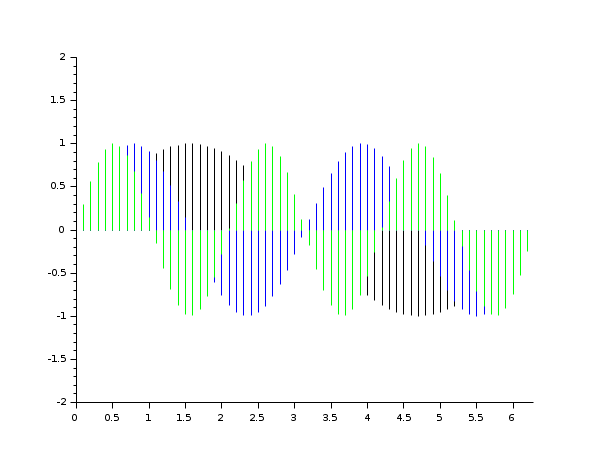
- plot2d3
Plot a curve with vertical bars
Example:
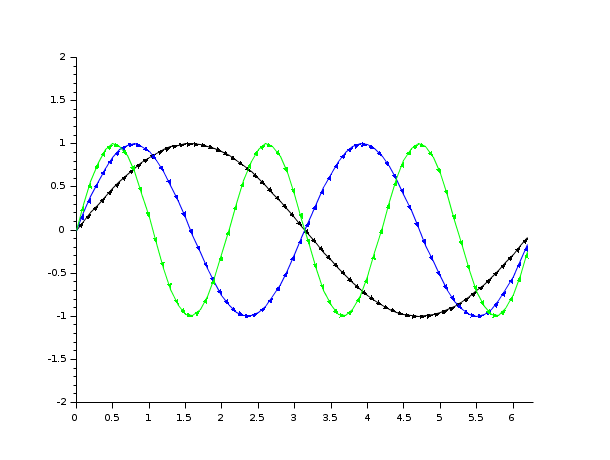
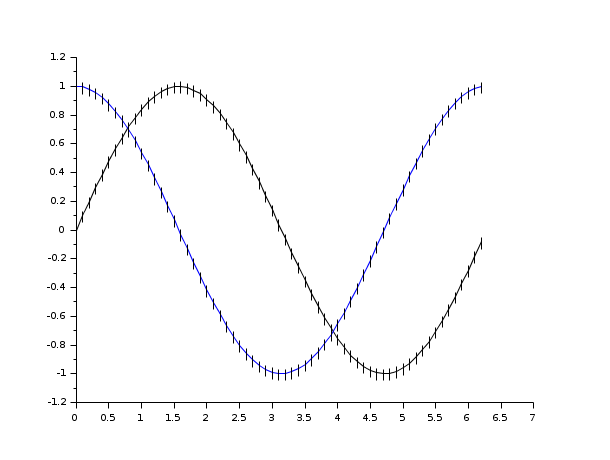
- plot2d4
Plot a curve with arrows
Example:
- fplot2d
Plot a curve defined by a function
Example:
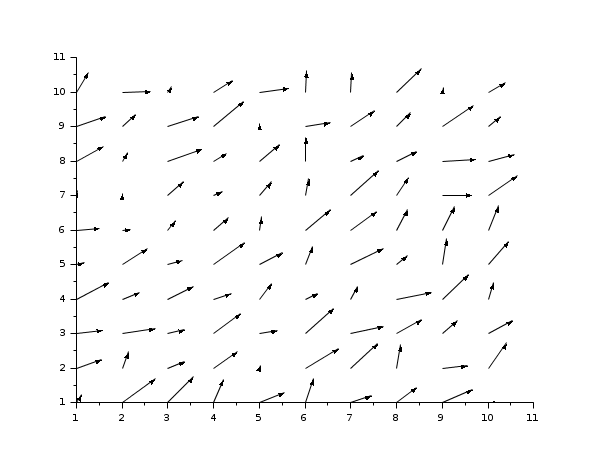
- champ
2D vector field
Example:
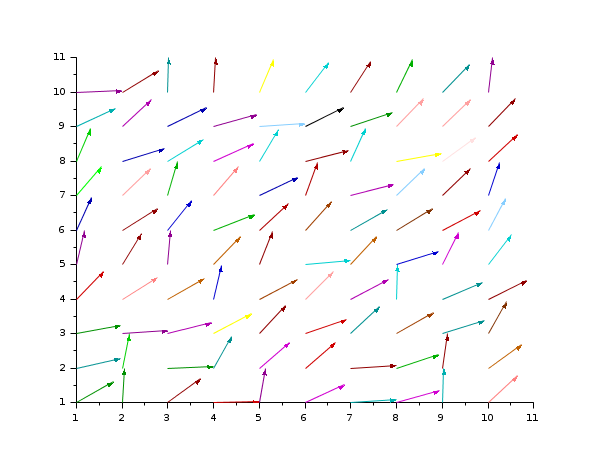
- champ1
2D vector field with colored arrows
Example:
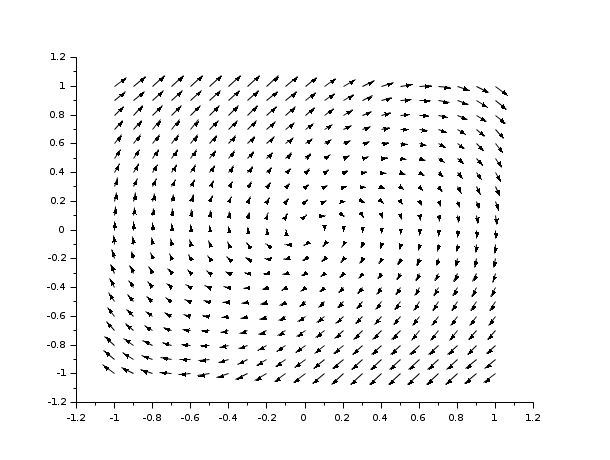
- fchamp
Direction field of a 2D first order ODE
Example:
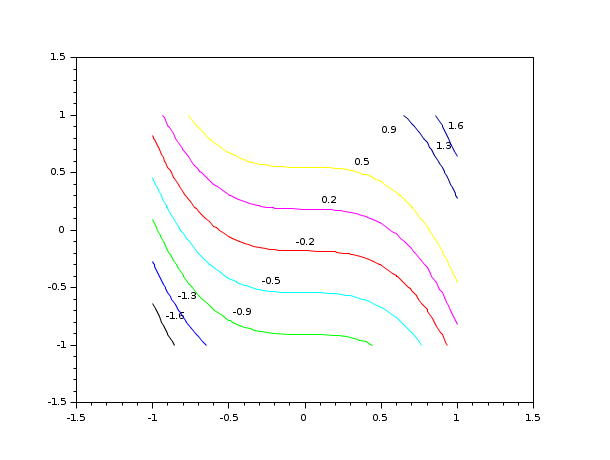
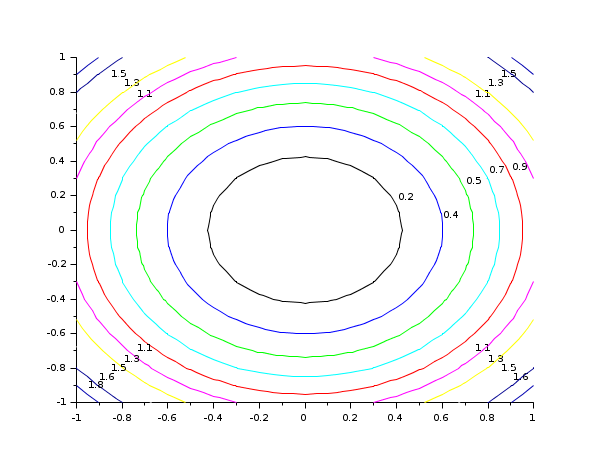
- contour2d
Level curves of a surface on a 2D plot
- fcontour2d
Level curves of a surface defined by a function on a 2D plot
Example:
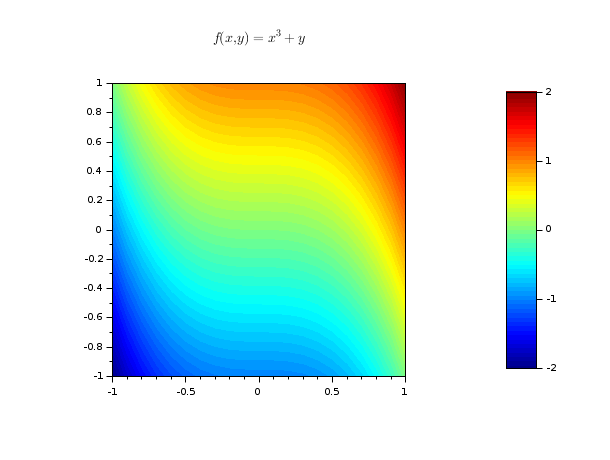
- grayplot
2D plot of a surface using colors
Example:
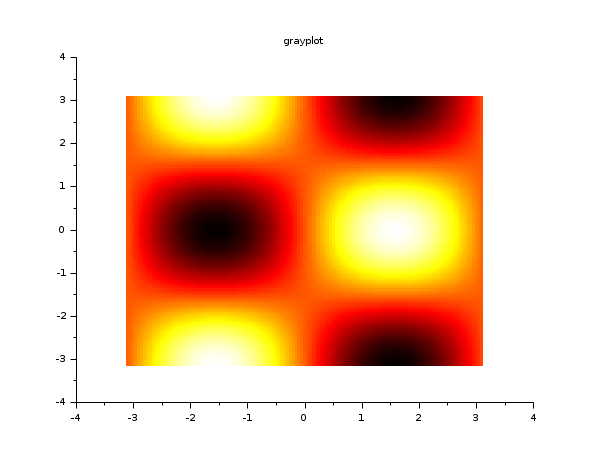
- fgrayplot
2D plot of a surface defined by a function using colors
Example:
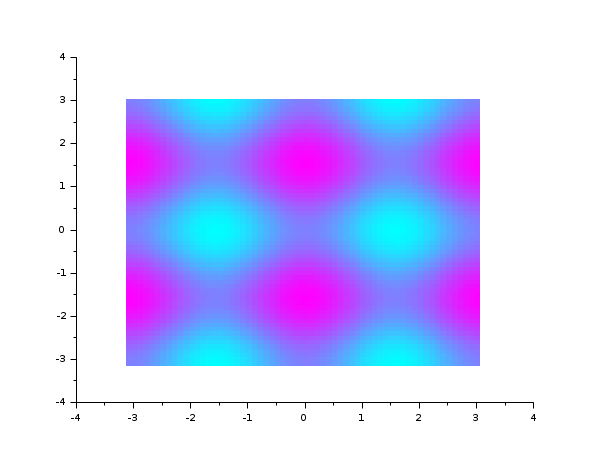
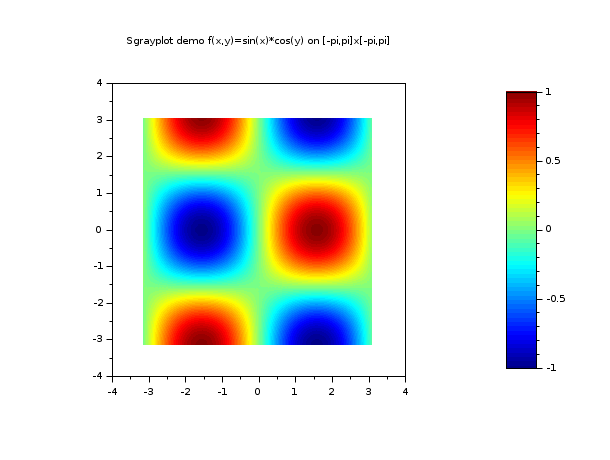
- Sgrayplot
Smooth 2D plot of a surface using colors
Example:
- Sfgrayplot
Smooth 2D plot of a surface defined by a function using colors
Example:
- xgrid
Add a grid on a 2D plot
Example:
- errbar
Add vertical error bars on a 2D plot
Example:
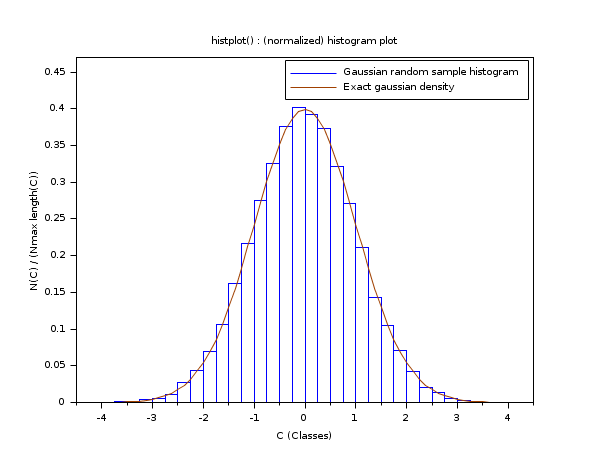
- histplot
Plot a histogram
Example:
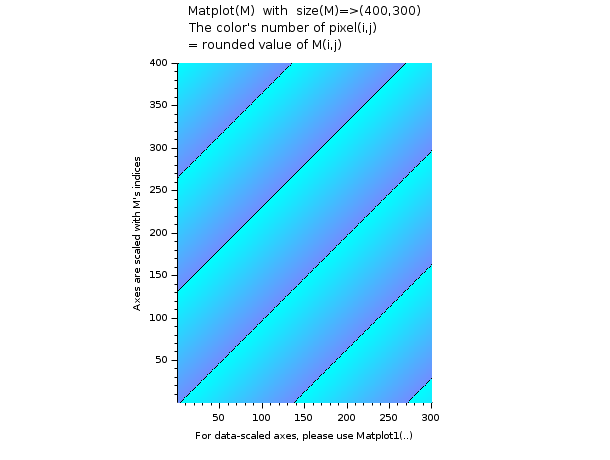
- Matplot
2D plot of a matrix using colors
Example:
3d plotting
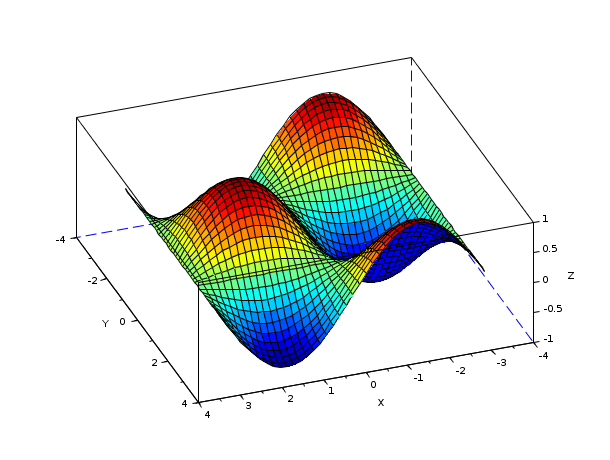
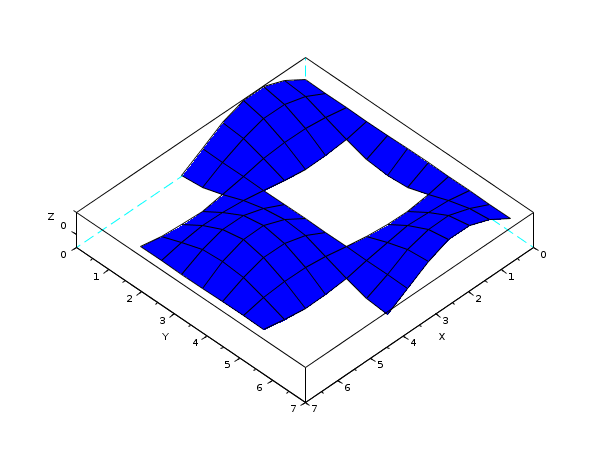
- plot3d
Plot a surface
Example:
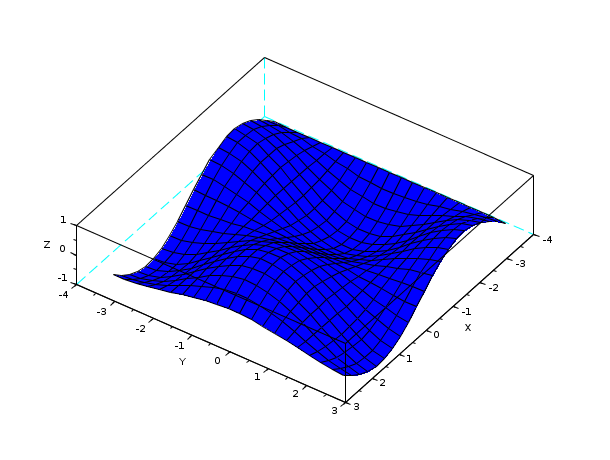
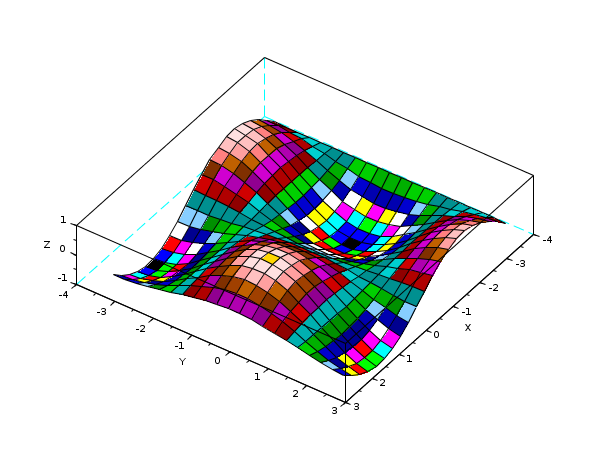
- plot3d1
Plot a surface with gray or color level
Example:

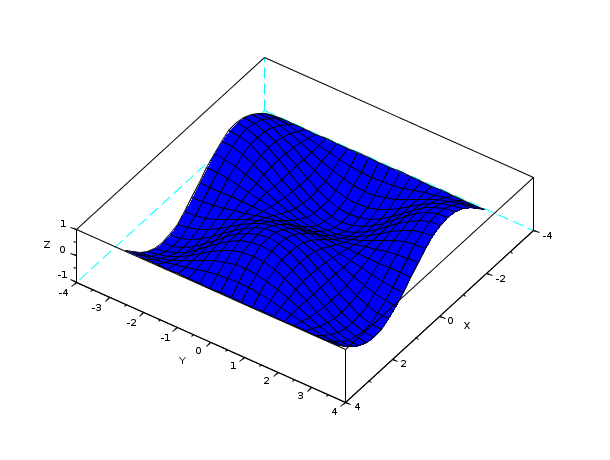
- fplot3d
Plot a surface defined by a function
Example:
- fplot3d1
Plot a surface defined by a function with gray or color level
Example:
- param3d
Plot one curve
Example:

- param3d1
Plots curves
Example:
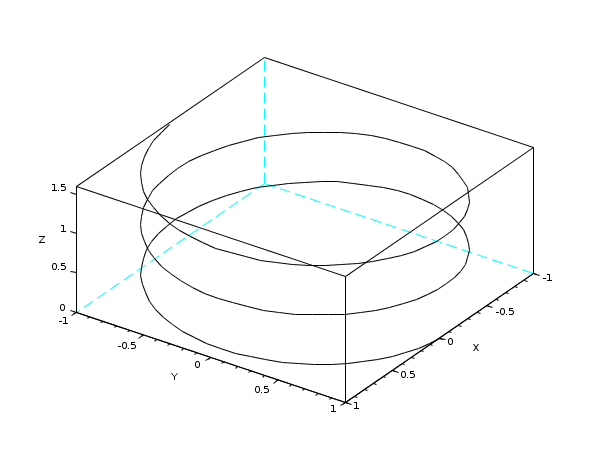
- contour
Level curves on a 3D surface
Example:
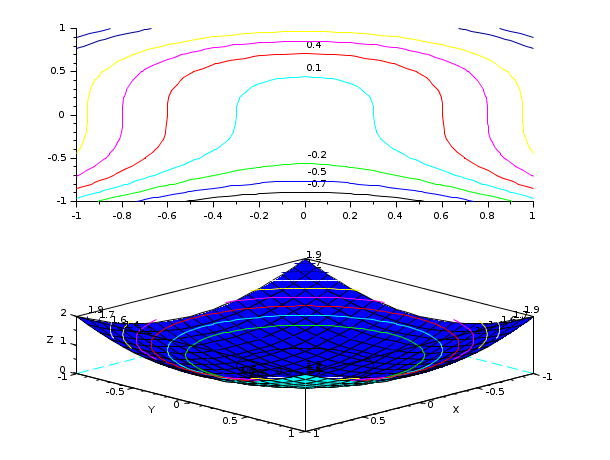
- fcontour
Level curves on a 3D surface defined by a function
Example:
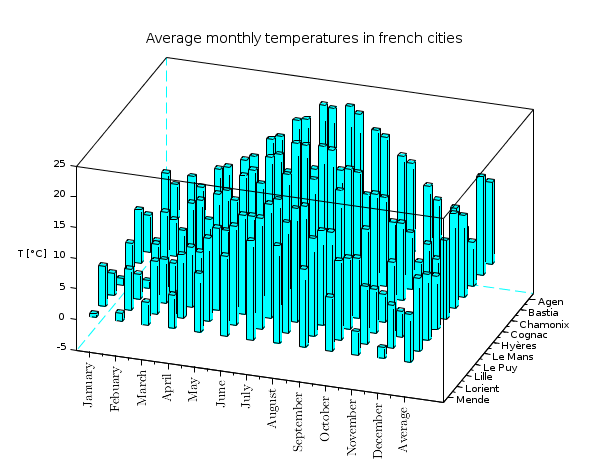
- hist3d
3D representation of a histogram
Example:
- genfac3d
Compute facets of a 3D surface
Example:
- eval3dp
Compute facets of a 3D surface
Example:
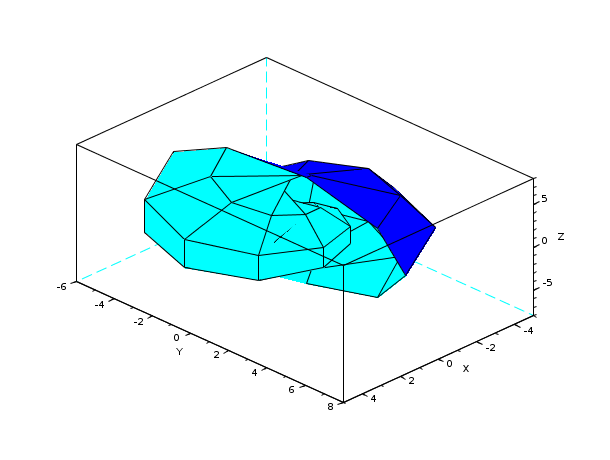
- geom3d
Projection from 3D on 2D after a 3D plot
Example:
Line and polygon plotting
Rectangle plotting
Arc plotting
Arrow plotting
- xarrows
Draw a set of arrows
Strings
Frames and axes
Coordinates transformations
- isoview
Set scales for isometric plot (do not change the size of the window)
 This function is obsolete.
- square
Set scales for isometric plot (change the size of the window)
- scaling
Affine transformation of a set of points
- rotate
Rotation of a set of points
- xsetech
Set the sub-window of a graphics window for plotting
- subplot
Divide a graphics window into a matrix of sub-windows
- xgetech
Get the current graphics scale
- xchange
Transform real to pixel coordinates
Colors
- colormap
Using colormaps
- getcolor
Dialog to select colors in the current colormap
- addcolor
Add new colors to the current colormap
- graycolormap
Linear gray colormap
- hotcolormap
Red to yellow colormap
Graphics context
Save and load
- xsave
Save graphics into a file
- xload
Load a saved graphics
- xs2bmp
Export graphics using the BMP format
- xs2emf
Export graphics using the EMF format
Only under Windows.- xs2eps
Export graphics using the EPS format
- xs2gif
Export graphics using the GIF format
- xs2jpg
Export graphics using the JPG format
- xs2pdf
Export graphics using the PDF format
- xs2png
Export graphics using the PNG format
- xs2ppm
Export graphics using the PPM format
- xs2ps
Export graphics using the PS format
- xs2svg
Export graphics using the SVG format
Graphics primitives
- clf
Clear or reset the current graphic figure (window) to default values
- xclear
Clear a graphics window
Functionxclearis obsolete.- driver
Select a graphics driver
- xinit
Initialisation of a graphics driver
- xend
Close a graphics session
- replot
Redraw the current graphics window with new boundaries
- xpause
Suspend Scilab
- show_window
Raise the current graphics window
- xdel
Delete a graphics window
- winsid
Return the list of graphics windows
- xname
Change the name of the current graphics window
Mouse position
Interactive editor
- edit_curv
Interactive graphics curve editor
Graphics functions for automatic control
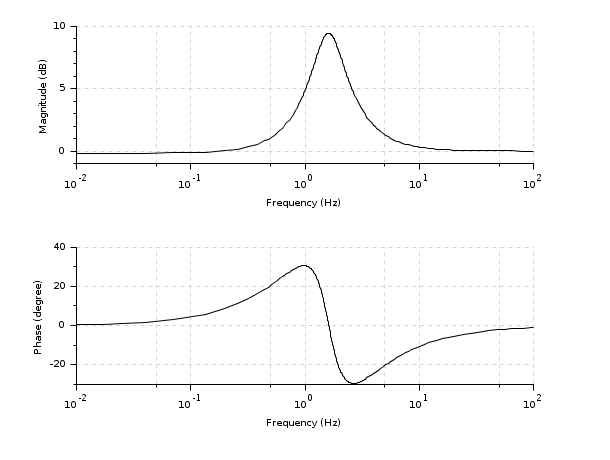
- bode
Bode plot
Example:
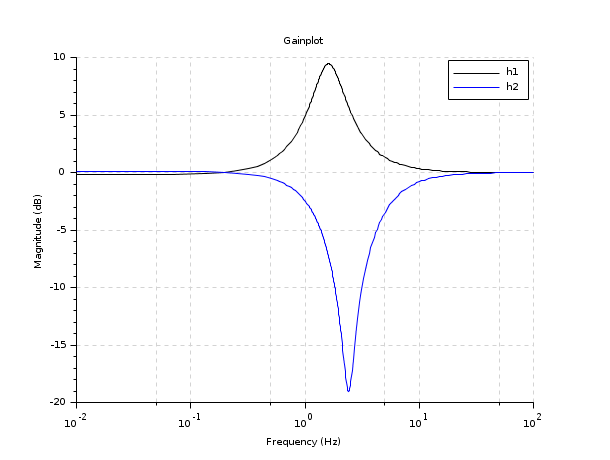
- gainplot
Magnitude plot
Example:
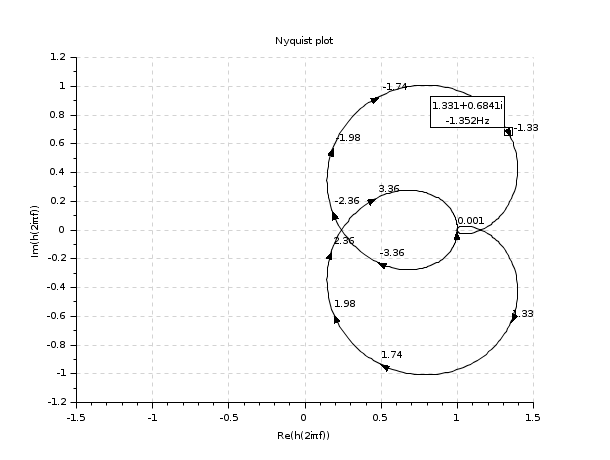
- nyquist
Nyquist plot
Example:
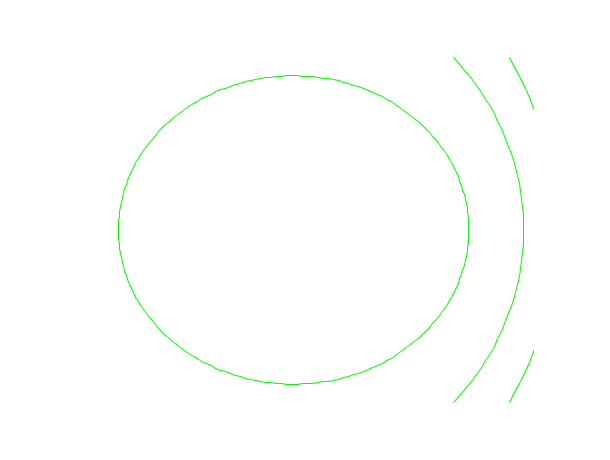
- m_circle
Plot the complex plane iso-gain contours of y/(1+y)
This function is obsolete.Example:
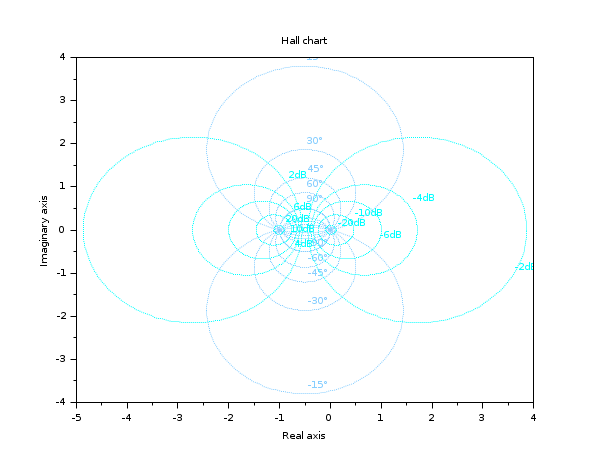
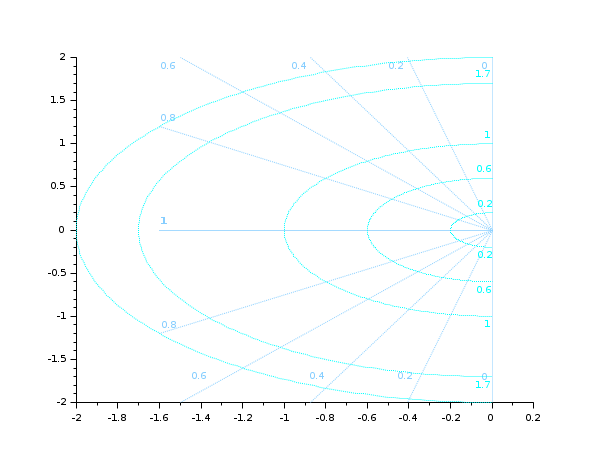
- hallchart
Hall chart
Example:
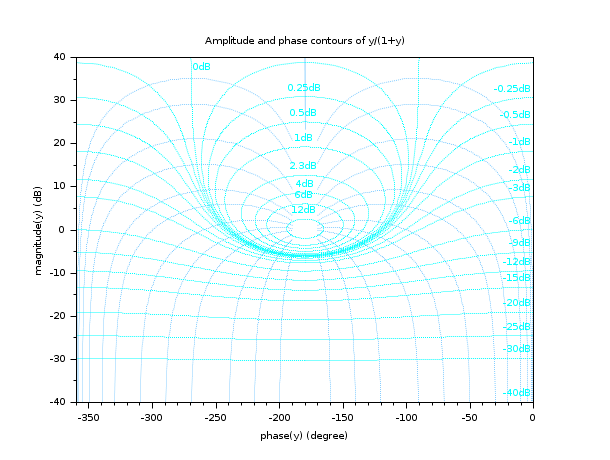
- nicholschart
Nichols chart
Example:
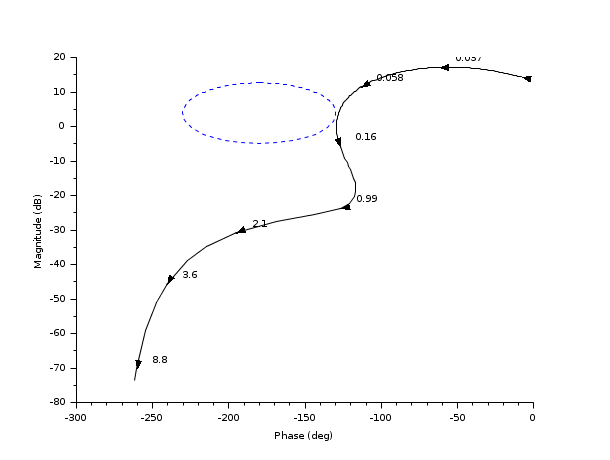
- black
Black's diagram
Example:
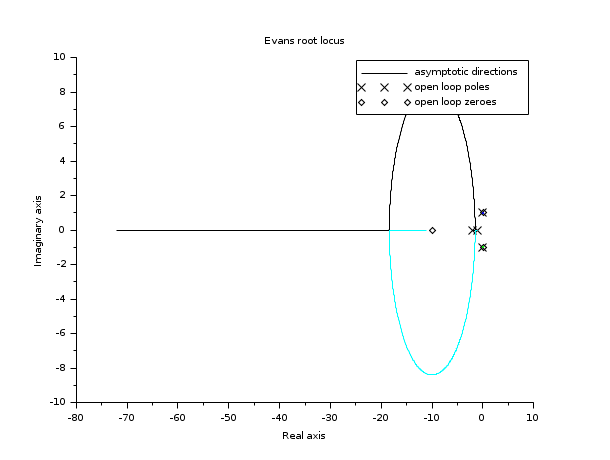
- evans
Evans root locus
Example:
- sgrid
s-plane grid lines
Example:
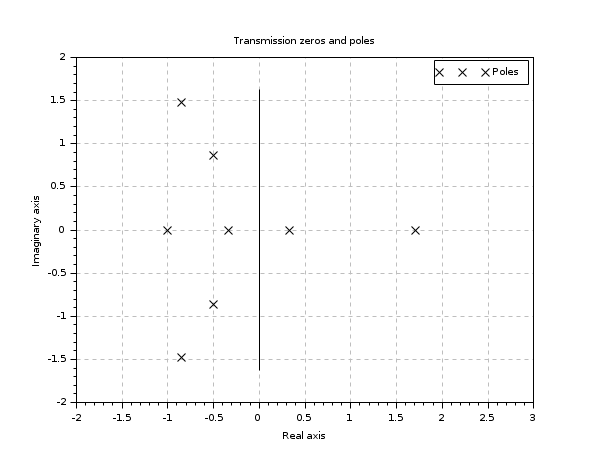
- plzr
pole-zero plot
Example:
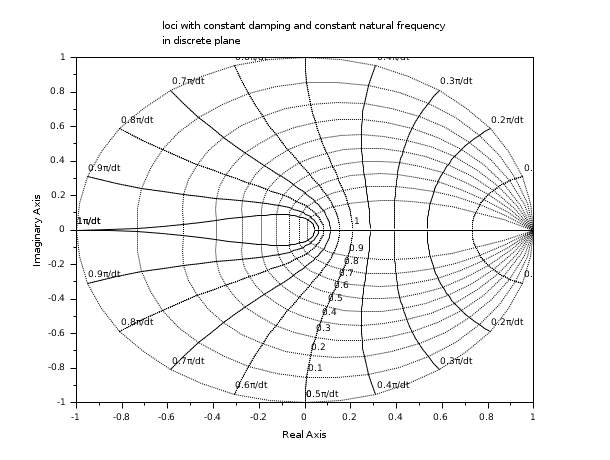
- zgrid
zgrid plot
Example:
| Report an issue | ||
| << GlobalProperty | Graphics | Compound properties >> |