- Справка Scilab
- Графики
- 2d_plot
- ВидЛинии
- свойства Matplot
- Sfgrayplot
- champ
- champ1
- comet
- contour2d
- contour2di
- contourf
- errbar
- Matplot
- Matplot1
- Sgrayplot
- champ properties
- fchamp
- fcontour2d
- fec
- fec properties
- fgrayplot
- fplot2d
- grayplot
- grayplot properties
- graypolarplot
- histplot
- paramfplot2d
- plot
- plot2d
- plot2d1
- plot2d2
- plot2d3
- plot2d4
- polarplot
Please note that the recommended version of Scilab is 2026.1.0. This page might be outdated.
See the recommended documentation of this function
polarplot
Plot polar coordinates
Calling Sequence
polarplot(theta,rho,[style,strf,leg,rect])
polarplot(theta,rho,<opt_args>)
Arguments
- rho
a vector, the radius values
- theta
a vector with same size than rho, the angle values.
- <opt_args>
a sequence of statements
key1=value1, key2=value2, ... where keys may bestyle,leg,rect,strforframeflag- style
is a real row vector of size nc. The style to use for curve
iis defined bystyle(i). The default style is1:nc(1 for the first curve, 2 for the second, etc.).- -
if
style(i)is negative, the curve is plotted using the mark with idabs(style(i))+1; usexset()to see the mark ids.- -
if
style(i)is strictly positive, a plain line with color idstyle(i)or a dashed line with dash idstyle(i)is used; usexset()to see the color ids.- -
When only one curve is drawn,
stylecan be the row vector of size 2[sty,pos]wherestyis used to specify the style andposis an integer ranging from 1 to 6 which specifies a position to use for the caption. This can be useful when a user wants to draw multiple curves on a plot by calling the functionplot2dseveral times and wants to give a caption for each curve.
- strf
is a string of length 3
"xy0".- default
The default is
"030".- x
controls the display of captions,
- x=0
no captions.
- x=1
captions are displayed. They are given by the optional argument
leg.
- y
controls the computation of the frame. same as frameflag
- y=0
the current boundaries (set by a previous call to another high level plotting function) are used. Useful when superposing multiple plots.
- y=1
the optional argument
rectis used to specify the boundaries of the plot.- y=2
the boundaries of the plot are computed using min and max values of
xandy.- y=3
like
y=1but produces isoview scaling.- y=4
like
y=2but produces isoview scaling.- y=5
like
y=1butplot2dcan change the boundaries of the plot and the ticks of the axes to produce pretty graduations. When the zoom button is activated, this mode is used.- y=6
like
y=2butplot2dcan change the boundaries of the plot and the ticks of the axes to produce pretty graduations. When the zoom button is activated, this mode is used.- y=7
like
y=5but the scale of the new plot is merged with the current scale.- y=8
like
y=6but the scale of the new plot is merged with the current scale.
- leg
a string. It is used when the first character x of argument
strfis 1.leghas the form"leg1@leg2@...."whereleg1,leg2, etc. are respectively the captions of the first curve, of the second curve, etc. The default is"".- rect
This argument is used when the second character y of argument
strfis 1, 3 or 5. It is a row vector of size 4 and gives the dimension of the frame:rect=[xmin,ymin,xmax,ymax].
Description
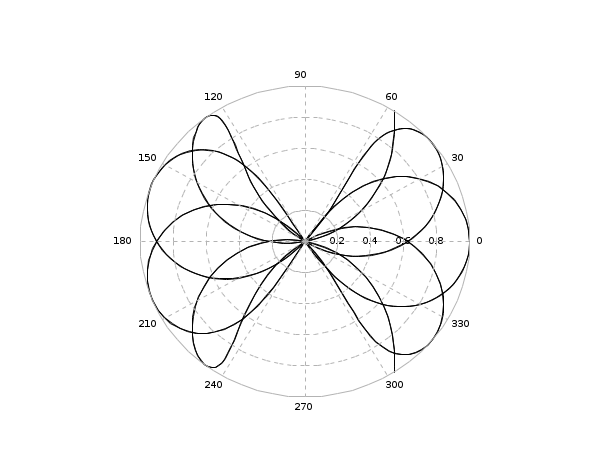
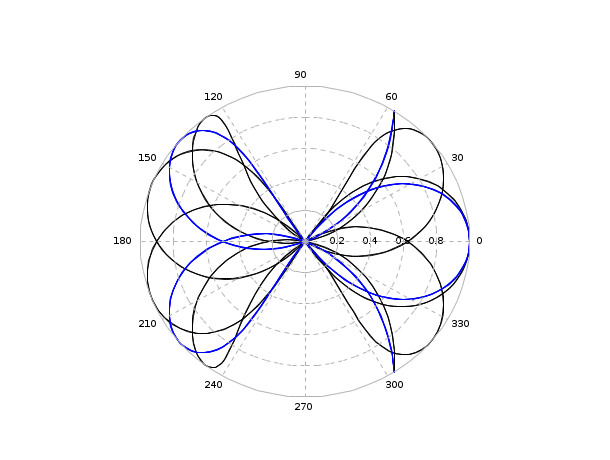
polarplot creates a polar coordinate plot of the angle theta versus the radius rho. theta is the angle from the x-axis to the radius vector specified in radians; rho is the length of the radius vector specified in dataspace units. Note that negative rho values cause the corresponding curve points to be reflected across the origin.
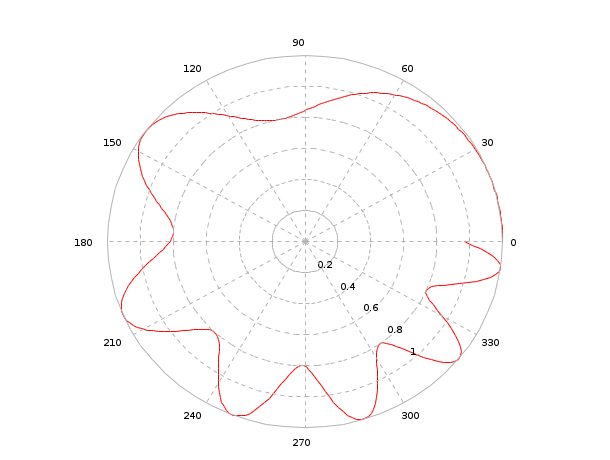
Example 4
clf()
theta=[0:0.02:2*%pi]';
rho=1+0.2*cos(theta.^2)
polarplot(theta,rho,style=5)
a=gca()
a.isoview='on'
a.data_bounds=[-1.2,-1.2;1.2,01.2]
| Report an issue | ||
| << plot2d4 | 2d_plot | 3d_plot >> |