Scilab 5.5.0
Please note that the recommended version of Scilab is 2026.1.0. This page might be outdated.
See the recommended documentation of this function
mese
maximum entropy spectral estimation
Calling Sequence
[sm,fr]=mese(x [,npts]);
Arguments
- x
Input sampled data sequence
- npts
Optional parameter giving number of points of
frandsm(default is 256)- sm
Samples of spectral estimate on the frequency grid
fr- fr
npts equally spaced frequency samples in
[0,.5)
Description
Calculate the maximum entropy spectral estimate of x
Sample
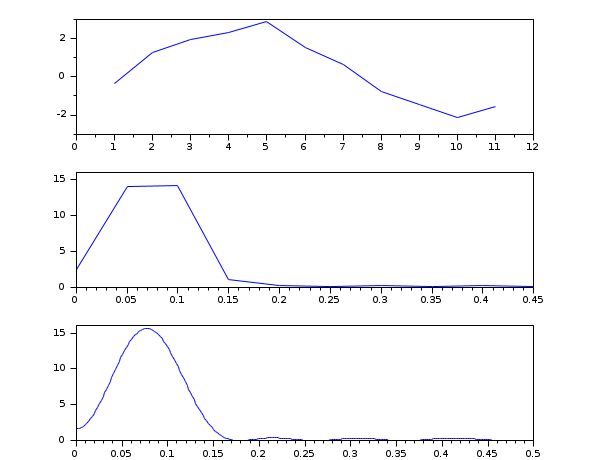
Examples
rand("seed",12345),
y = (0:10);
x1 = sin(2*%pi*y/20);
x2 = sin(3.5*%pi*y/20);
w = .4*(rand(y)-.5*ones(y));
x = x1+2*x2+w;
[sm,fr1] = mese(x,10)
// Define macro which computes the
// Blackman-Tukey periodogram
function [xm, fr]=bt(x)
  xsize = max(size(x))
  [xf,fr] = frmag(x,256)
  xm = xf.*conj(xf)/xsize
endfunction
[xm,fr] = bt(x);
scf();
subplot(3,1,1);
plot(x);
subplot(3,1,2);
plot(fr1,sm)
subplot(3,1,3);
plot(fr,xm)
| Report an issue | ||
| << intdec | spectral_estimation | pspect >> |