Please note that the recommended version of Scilab is 2026.1.0. This page might be outdated.
See the recommended documentation of this function
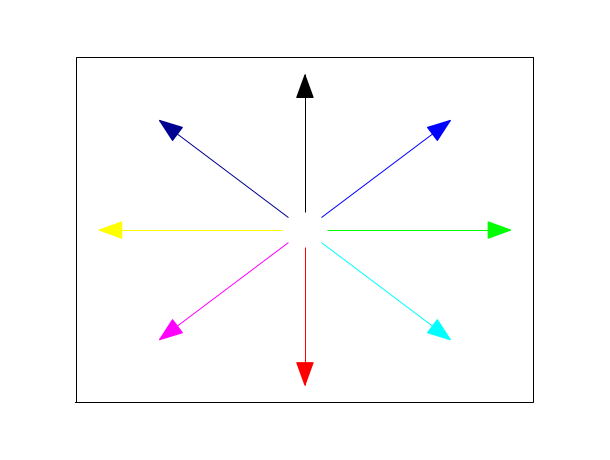
xarrows
一連の矢印を描画
呼び出し手順
xarrows(nx, ny, [arsize, color])
引数
- nx,ny
同じ大きさの実数のベクトルまたは行列e.
- arsize
実数スカラー, 矢じりの大きさ. デフォルト値は
arsizeを -1 に設定することにより得られます.- color
行列またはスカラー.
colorが正のスカラーの場合, この値は全ての矢印に使用される色を指定します. 負のスカラーの場合,カレントの色が使用されます. ベクトルの場合,color(i)はi番目の 矢印に使用される色を指定します.
説明
xarrowsはnx および ny
により指定される矢印の集合を描画します.
nx および nyがベクトルの場合,
i番目の矢印は
(nx(i),ny(i))-->(nx(i+1),ny(i+1))により定義されます.
nx および ny が行列の場合:
nx=[xi_1 x1_2 ...; xf_1 xf_2 ...]
ny=[yi_1 y1_2 ...; yf_1 yf_2 ...]
k番目の矢印は (xi_k,yi_k)-->(xf_k,yf_k)
により定義されます.
xarrowsは,
plot2dのような高レベル関数をコールすることにより
設定可能なカレントのグラフィックスケールを使用します.
例
例
| Report an issue | ||
| << xarcs | geometric_shapes | xfarc >> |