Scilab 5.5.0
Please note that the recommended version of Scilab is 2026.1.0. This page might be outdated.
See the recommended documentation of this function
nanreglin
Linear regression
Calling Sequence
[a,b]=nanreglin(x,y)
Arguments
- x, y, a, b
numerical vectors or matrices.
Description
Solve the regression problem y=a*x+b in the least square sense.
x and y are two matrices of size
x(p,n) and y(q,n), where n is the number of samples.
The estimator a is a matrix of size (q,p) and b is a
vector of size (q,1).
Each line of y is treated as an independent problem, if x
or y contain a NaN (x(i,j) = %nan or y(i,j) = %nan),
then x(:,j) and y(i,j) are ignored,
as if the point [x(:,j); y(i,j)] did not exist.
Examples
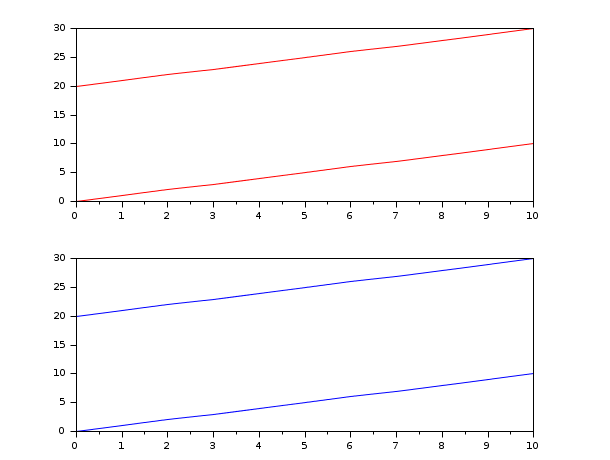
Graphical example #1:
// In the following example, both problems represent two straight lines:
// one goes from (0,0) to (10,10) and the other one goes from (0,20) to (10,30).
// reglin and nanreglin find the same values because all the points are aligned and the NaNs have been ignored.
subplot(211)
x = 0:10;
y = 20:30;
[a1, b1] = reglin(x, [x ; y]);
plot(x', (a1*x+repmat(b1,1,11))', "red")

subplot(212)
y2 = y;
y2(2:10) = %nan; // Leaving y2(1) and y2(11) unchanged.
[a2, b2] = nanreglin(x, [x ; y2])
plot(x', (a2*x+repmat(b2,1,11))', "blue")
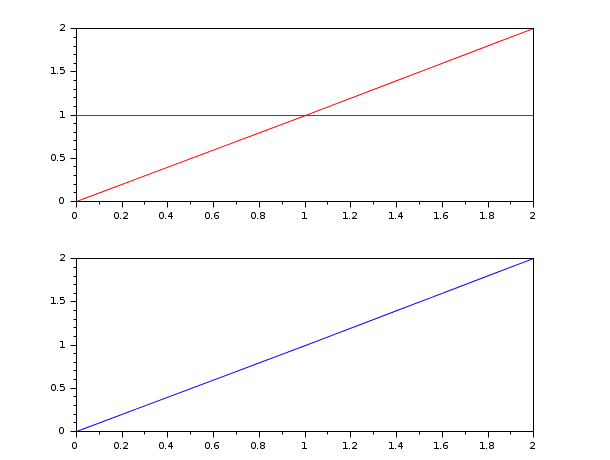
Graphical example #2:
// Now both problems represent one straight line (reglin(x, x)) from (0,0) to (2,2),
// but while the second argument of the first problem (reglin(x, y)) represents
// a flat line (with equation y = 1), the second argument of the second problem
// (reglin(x, y2)) ignores the central point of y (set to %nan) so the flat line
// now has equation y = 0, because the two remaining points are (0,0) and (2,0).
subplot(211)
x = 0:2;
y = [0 3 0];
[a1, b1] = reglin(x, [x ; y]);
plot(x', (a1*x+repmat(b1,1,3))', "red")

subplot(212)
y2 = y;
y2(2) = %nan; // y2 = [0 %nan 0];
[a2, b2] = nanreglin(x, [x ; y2]);
plot(x', (a2*x+repmat(b2,1,3))', "blue")
History
| バージョン | 記述 |
| 5.5.0 | Introduction |
| Report an issue | ||
| << thrownan | Data with Missing Values | Descriptive Statistics >> |