Please note that the recommended version of Scilab is 2026.1.0. This page might be outdated.
See the recommended documentation of this function
captions
draw graph captions
Calling Sequence
hl=captions(h, strings [,location])
Arguments
- h
vector of handles on polyline entities.
- strings
n vector of strings, strings(i) is the caption of the ith polyline
- hl
a handle of type "
Legend", points to the structure containing all the captions information (see legend_properties.
- location
a character string with possible values:
"in_upper_right": captions are drawn in the upper right corner of the axes box."in_upper_left": captions are drawn in the upper left corner of the axes box."in_lower_right": captions are drawn in the lower right corner of the axes box."in_lower_left": captions are drawn in the lower left corner of the axes box."out_upper_right": captions are drawn at the right of the upper right corner of the axes box."out_upper_left": captions are drawn at the left of the upper left corner of the axes box."out_lower_right": captions are drawn at the right of the lower right corner of the axes box."out_lower_left": captions are drawn at the left of the lower left corner of the axes box."upper_caption": captions are drawn above the upper left corner of the axes box."lower_caption": captions are drawn below the lower left corner of the axes box. This option correspond to thelegargument of plot2d"by_coordinates": the upper left corner of the captions box is given by the "position" field of the associated data structure. Thexandypositions are given as fractions of theaxes_bounds sizes.
Description
Puts captions on the current plot at the in the bottom left corner
of the graphic window using the specified strings as labels.
captions prepends labels by a recall of the
corresponding polylines. The type and properties are recovered from the
given handles:
The captions function creates a Legend data structure.
There is at most one Legend associated with each
axes. If the caption function is recalled while a
Legend still exist the old one is replaced.
Examples
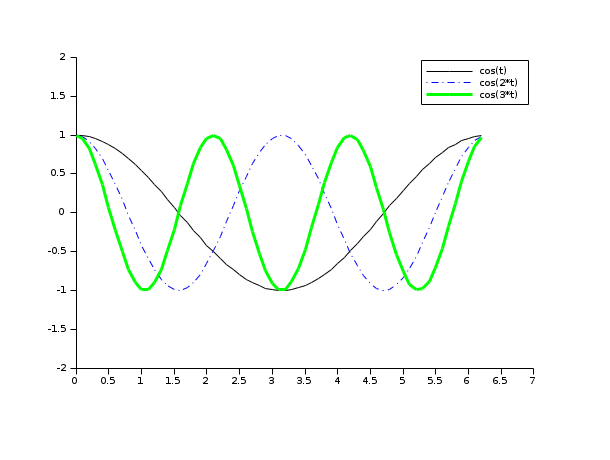
t=0:0.1:2*%pi;
a=gca();a.data_bounds=[t(1) -1.8;t($) 1.8];
a.margins(4)=0.2;

plot2d(t,[cos(t'),cos(2*t'),cos(3*t')],[1,2 3]);
e=gce();
e.children(1).thickness=3;
e.children(2).line_style=4;

hl=captions(e.children,['cos(t)';'cos(2*t)';'cos(3*t)']);
hl=captions(e.children,['cos(t)';'cos(2*t)';'cos(3*t)'],'in_upper_right');

hl.legend_location='in_upper_right'
hl.fill_mode='on';
See Also
- plot2d — 2D plot
- legend — draw graph legend
- polyline_properties — description of the Polyline entity properties
- legend_properties — description of the Legend entity properties.
| Report an issue | ||
| << legends | annotation | Label entity properties >> |