Scilab Website | Contribute with GitLab | Mailing list archives | ATOMS toolboxes
Scilab Online Help
5.4.1 - 日本語

Change language to:
English - Français - Português - Русский

Please note that the recommended version of Scilab is 2024.0.0. This page might be outdated.
See the recommended documentation of this function

Scilab help >> Graphics > geometric_shapes > xrects

xrects

一連の矩形を描画または塗りつぶす

呼び出し手順

xrects(rects,[fill])

引数

rects

大きさ (4,n)の行列.

fill

大きさ nのベクトル.

説明

xrectsは一連の矩形を描画または塗りつぶします. rectsの各列は矩形(左上の点,幅,高さ)をユーザ座標で記述します: rects=[x1 y1 w1 h1;x2 y2 w2 h2;...]'.

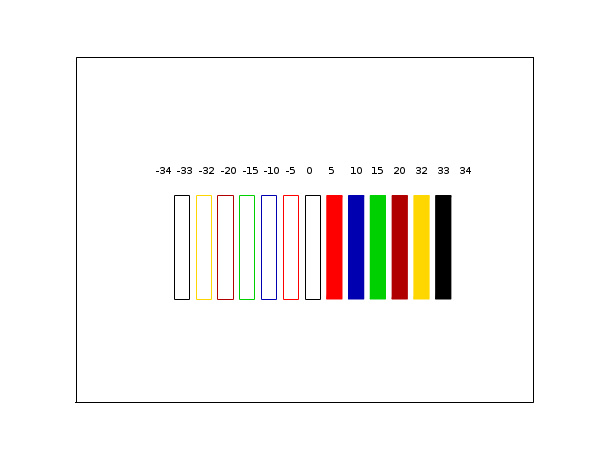
fill(i) は矩形iを塗りつぶしまたは描画する際に使用される パターンを指定します:

fill(i)<0の場合, 矩形 i は 線種(または色)-fill(i)により描画されます

fill(i)>0の場合, 矩形i は パターン(または色)fill(i)により塗りつぶされます.

fill(i)=0の場合, 矩形iはカレントの 線種(または色)で描画されます.

警告: 高さは下向きが正です.

plot2d([-100,500],[-50,50],[-1,-1],"022")
cols=[-34,-33,-32,-20:5:20,32,33,34];
x=400*(0:14)/14; step=20;
rects=[x;10*ones(x);step*ones(x);30*ones(x)];
xrects(rects,cols)
xnumb(x,15*ones(x),cols)

参照

  • xfrect — 矩形を塗りつぶす
  • xrect — 矩形を描画する
Report an issue
<< xrect geometric_shapes handle >>

Copyright (c) 2022-2023 (Dassault Systèmes)
Copyright (c) 2017-2022 (ESI Group)
Copyright (c) 2011-2017 (Scilab Enterprises)
Copyright (c) 1989-2012 (INRIA)
Copyright (c) 1989-2007 (ENPC)
with contributors
Last updated:
Tue Apr 02 17:37:33 CEST 2013