Please note that the recommended version of Scilab is 2026.1.0. This page might be outdated.
See the recommended documentation of this function
xarrows
draw a set of arrows
Calling Sequence
xarrows(nx, ny, [arsize, color])
Arguments
- nx, ny
real vectors or matrices of same size.
- arsize
a real scalar, size of the arrow head. The default value can be obtained by setting
arsizeto-1.- color
a matrix or scalar. If
coloris a positive scalar it gives the color to use for all arrows. If it is a negative scalar then the current color is used. If it is a vectorcolor(i)gives the color to use for arrowi.
Description
xarrows draws a set of arrows
given by nx and ny.
If nx and ny are vectors,
the i-th arrow is defined by
(nx(i),ny(i))-->(nx(i+1),ny(i+1)).
If nx and ny are matrices:
nx=[xi_1 x1_2 ...; xf_1 xf_2 ...]
ny=[yi_1 y1_2 ...; yf_1 yf_2 ...]
the k-th arrow is defined by (xi_k,yi_k)-->(xf_k,yf_k).
xarrows uses the current graphics
scale which can be set by calling a high level
drawing function such as plot2d.
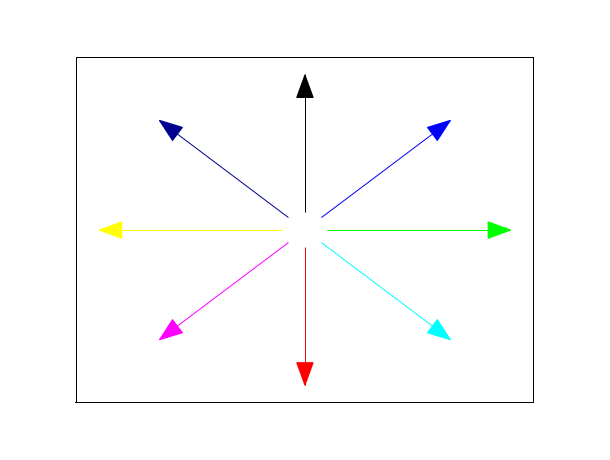
Examples
x = 2*%pi*(0:7)/8
x1 = [sin(x); 9*sin(x)];
y1 = [cos(x); 9*cos(x)];
plot2d([-10,10], [-10,10], [-1,-1], "022")
xset("clipgrf")
xarrows(x1, y1, -1, [1:7,9]) //8-th color is white
xset("clipoff")
| Report an issue | ||
| << xarcs | geometric_shapes | xfarc >> |