Scilab 5.4.1
Please note that the recommended version of Scilab is 2026.1.0. This page might be outdated.
However, this page did not exist in the previous stable version.
m_circle
plots the complex plane iso-gain contours of y/(1+y) (obsolete)
Calling Sequence
m_circle()
m_circle(gain)
Arguments
- gain
vector of gains (in DB). The default value is
- gain
=[-12 -8 -6 -5 -4 -3 -2 -1.4 -1 -.5 0.25 0.5 0.7 1 1.4 2 2.3 3 4 5 6 8 12]
Description
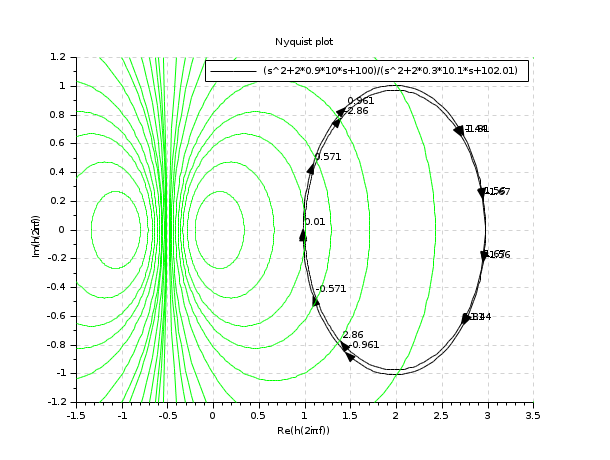
m_circle draws the iso-gain contours
given by then gain argument in the complex
plane (Re,Im).
The default value for gain is:
[-12 -8 -6 -5 -4 -3 -2 -1.4 -1 -.5 0.25 0.5 0.7 1 1.4 2 2.3 3 4 5 6 8 12]
m_circle is used with nyquist.
This function is superseded by the hallchart function.
Examples
s=poly(0,'s')
h=syslin('c',(s^2+2*0.9*10*s+100)/(s^2+2*0.3*10.1*s+102.01))
nyquist(h,0.01,100,'(s^2+2*0.9*10*s+100)/(s^2+2*0.3*10.1*s+102.01)')
m_circle();
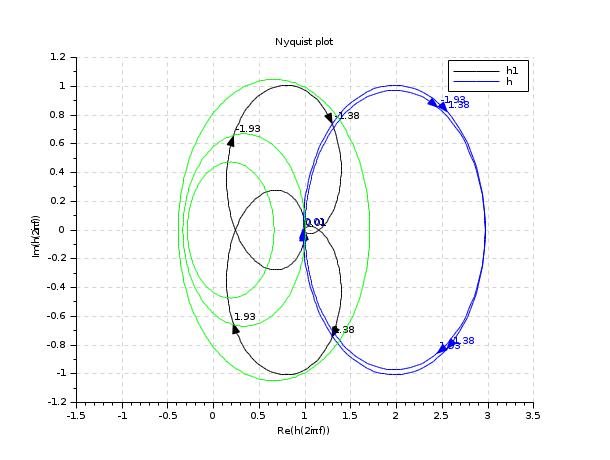
clf();
s=poly(0,'s')
h=syslin('c',(s^2+2*0.9*10*s+100)/(s^2+2*0.3*10.1*s+102.01))
h1=h*syslin('c',(s^2+2*0.1*15.1*s+228.01)/(s^2+2*0.9*15*s+225))
nyquist([h1;h],0.01,100,['h1';'h'])
m_circle([-8 -6 -4]);
See Also
| Report an issue | ||
| << hallchart | Plot and display | nicholschart >> |