Please note that the recommended version of Scilab is 2026.1.0. This page might be outdated.
See the recommended documentation of this function
drawaxis
draw an axis
Calling Sequence
drawaxis([options])
// options: x,y,dir,sub_int,fontsize,format_n,seg,textcolor,ticscolor,tics
Arguments
- dir=string
used to specify the tics direction.
stringcan be chosen among 'u','r','d','l' and 'l' is the default value. the values 'u','r','d','l' stands respectively for up, right, down, left- tics=string
A flag which describes how the tics are given.
stringcan be chosen among 'v','r', and 'i', and, 'v' is the default value- x,y
two vectors which give tics positions.
- val= string matrix
A string matrix, which, when given, gives the string to be drawn along the axis at tics positions.
- fontsize=int
specifies the fontsize to use for displaying values along the axis. Default value is
-1which stands for current fontsize- format_n=string
format to use for displaying numbers along the axis, where
stringgives the format according to the C language printf function format syntax (for examplestring="%.3f").- seg= 1 or 0
A flag which controls the display of the base segment of the axis (default value is 1).
- sub_int=integer
an integer which gives the number of sub-intervals to draw between large tics.
- textcolor=integer
specify the color to use for displaying values along the axis. Default value is
-1which stands for current color.- ticscolor=integer
specify the color to use for tics drawing. Default value is
-1which stands for current color.
Description
drawaxis is used to draw an axis in vertical or horizontal
direction. the direction of the axis is given by dir
dir = 'u' or 'd' gives a horizontal axis
with tics going up ('u') or down ('d').
dir = 'r' or 'l' give a vertical axis
with tics going right ('r') or left ('l').
x and y give the axis tics positions.
If the axis is horizontal then y
must be a scalar or can be omitted and x
is a Scilab vector. The meaning of x
is controlled by tics.
If tics='v' then x gives the tics positions along the x-axis.
If tics='r' then x must be of size 3. x=[xmin,xmax,n] and
n gives the number of intervals.
If tics='i' then x must be of size 4, x=[k1,k2,a,n].
then xmin=k1*10^a, xmax=k2*10^a and n gives the number of intervals
If y is omitted then the axis will be positioned at
the top of the frame if dir='u' or at the bottom if dir='d'
By default, numbers are drawn along the axis. They are drawn using
a default format which can be changed with format_n.
It is also possible to display given strings and not numbers,
this is done if val is provided. The size of val must
match the number of tics.
Examples
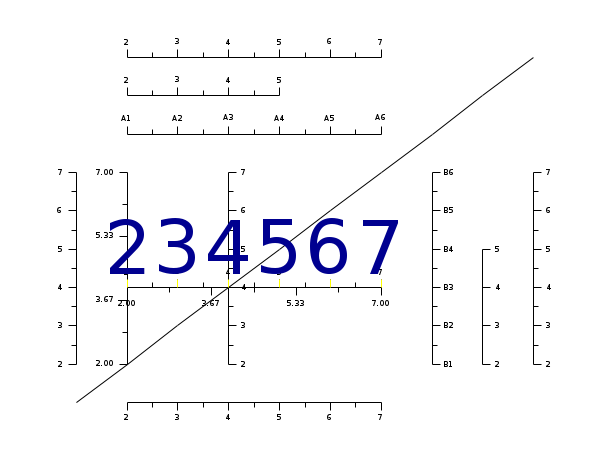
plot2d(1:10,1:10,1,"020")
// horizontal axis
drawaxis(x=2:7,y=4,dir='u',tics='v')
// horizontal axis on top of the frame
drawaxis(x=2:7,dir='u',tics='v')
// horizontal axis at the bottom of the frame
drawaxis(x=2:7,dir='d',tics='v')

// horizontal axis given by a range
drawaxis(x=[2,7,3],y=4,dir='d',tics='r')

// vertical axis
drawaxis(x=4,y=2:7,dir='r',tics='v')
drawaxis(x=2,y=[2,7,3],dir='l',tics='r')
drawaxis(y=2:7,dir='r',tics='v')
drawaxis(y=2:7,dir='l',tics='v')

// horizontal axis with strings displayed at tics positions
drawaxis(x=2:7,y=8,dir='u',tics='v',val='A'+string(1:6));
// vertical axis with strings displayed at tics positions
drawaxis(x=8,y=2:7,dir='r',tics='v',val='B'+string(1:6));

// horizontal axis given with a 'i' range.
drawaxis(x=[2,5,0,3],y=9,dir='u',tics='i');
drawaxis(x=9,y=[2,5,0,3],dir='r',tics='i',sub_int=5);

// horizontal axis again
drawaxis(x=2:7,y=4,dir='u',tics='v',fontsize=10,textcolor=9,ticscolor=7,seg=0,sub_int=20)
See Also
- axis_properties — description of the axis entity properties
| Report an issue | ||
| << axis properties | axis | bar_histogram >> |