- Aide Scilab
- Graphiques
- 2d_plot
- contour2di
- contourf
- errbar
- fec
- fgrayplot
- histplot
- paramfplot2d
- LineSpec
- Matplot
- Matplot1
- Matplot_properties
- Sfgrayplot
- Sgrayplot
- champ
- champ1
- champ_properties
- comet
- contour2d
- fchamp
- fcontour2d
- fec_properties
- fplot2d
- grayplot
- grayplot_properties
- graypolarplot
- plot
- plot2d
- plot2d1
- plot2d2
- plot2d3
- plot2d4
- polarplot
Please note that the recommended version of Scilab is 2026.1.0. This page might be outdated.
However, this page did not exist in the previous stable version.
plot2d1
2D plot (logarithmic axes). This function is obsolete.
Calling Sequence
plot2d1(str,x,y,[style,strf,leg,rect,nax])
Arguments
- str
is a string of length three
"abc".- a
can have the following values:
e,oorg.- e
means "empty". Itspecifies the fact that the value of
xis not used (thexvalues are supposed to be regularly spaced, ie 1:<number of rows ofy>). The user must anyway give a value forx, 1 for instance:plot2d1("enn",1,y).- o
means "one". If there are many curves, they all have the same x-values:
xis a column vector of size nl andyis a matrix of size (nl,nc). For example :x=[0:0.1:2*%pi]';plot2d1("onn",x,[sin(x) cos(x)]).- g
means "general".
xandymust have the same size (nl,nc). Each column ofyis plotted with respect to the corresponding column ofx.nccurves are plotted usingnlpoints.
- b, c
can have the values
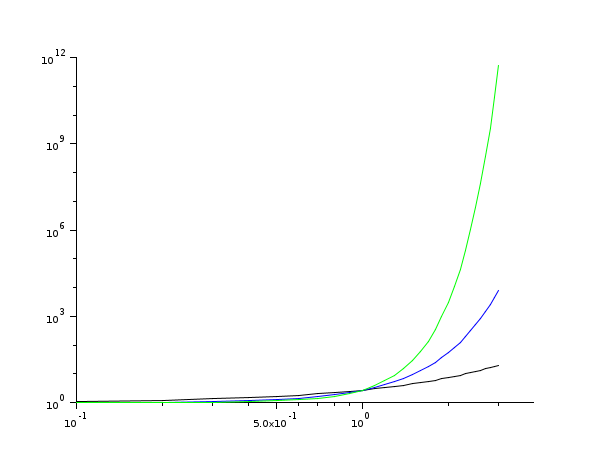
n(normal) orl(logarithmic).- b=l
a logarithmic axis is used on the x-axis
- c=l
a logarithmic axis is used on the y-axis
- x,y,[style,strf,leg,rect,nax]
these arguments have the same meaning as in the
plot2dfunction.- opt_args
these arguments have the same meaning as in the
plot2dfunction.
Description
This function is obsolete. USE plot2d INSTEAD !!
plot2d1 plots a set of 2D curves. It is the same as
plot2d but with one more argument str which
enables logarithmic axis. Moreover, it allows to specify only one column
vector for x when it is the same for all the curves.
By default, successive plots are superposed. To clear the previous
plot, use clf.
Enter the command plot2d1() to see a demo.
Examples
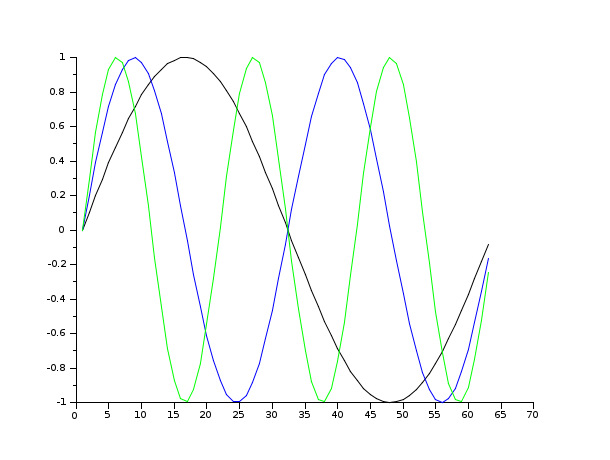
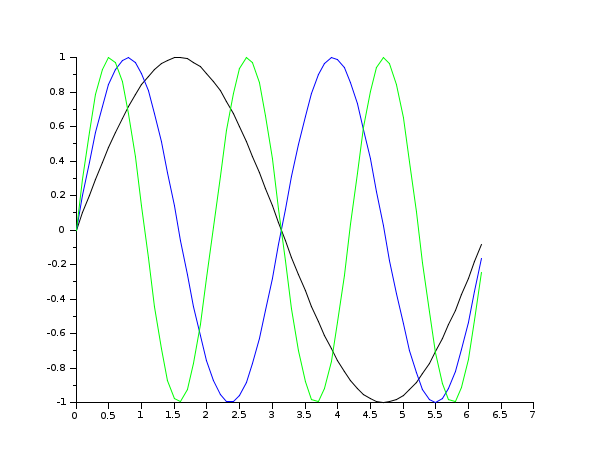
// multiple plot using only one x
clf()
x=[0:0.1:2*%pi]';
plot2d1("onn",x,[sin(x) sin(2*x) sin(3*x)])
See Also
| Report an issue | ||
| << plot2d | 2d_plot | plot2d2 >> |