Please note that the recommended version of Scilab is 2026.1.0. This page might be outdated.
However, this page did not exist in the previous stable version.
datatipInitStruct
Initialize the datatip structure associated with the given polyline.
Calling Sequence
ok=datatipInitStruct(curve_handle,varargin)
Arguments
- curve_handle
A handle on an entity compatible with datatips
- varargin
A sequence of pairs (<field name>,<field value>) used to add or customize fields of the datatips data structure.
- ok
notification flag. set to %f if the datatip structure cannot be stored in the curve user_data field.
Description
This function is called by datatipCreateto create a data structure for tips stored in the polyline entity user_data field.
This function as to be called only is one want to customize the datatips data structure fields
Datatip data structure
The datatips data structure is a tlist of
type "datatips" with at least the following
fields.
- interpolate
A boolean, indicating if the tips position can be interpolated between mesh points or not.
- replace
A boolean, indicating if adding a new tip erases the others or not
- style
A two elements vector with integer values.
style(1)is a number in[1 2]that gives the datatips style,style(2)is a number in[0 1].If set to 1 the datatip text is boxed (see datatipSetStyle).- formatfunction
A Scilab function, the function which is called to format the text that appears in the datatips. It as the following calling sequence:
str=datatipDefaultDisplay(curve_handle,pt,index)wherecurve_handleis handle on the polyline or surface,ptis the coordinates of the point andindexis the index of the point in the data or is empty in case of interpolated mode.- selected
A scalar with integer value: the index of the selected datatip if any or 0.
- tips
An array of handles. Each of these points to a given tip on the curve. This field cannot be changed by the
datatipInitStructfunction.
Others fields can be added by the programmer to the datatips
data structure through the datatipInitStruct
varargin optional arguments.
See Also
- datatipCreate — Create a data tip on a polyline by program
- datatips — Tool for placing and editing tips along the plotted curves.
Examples
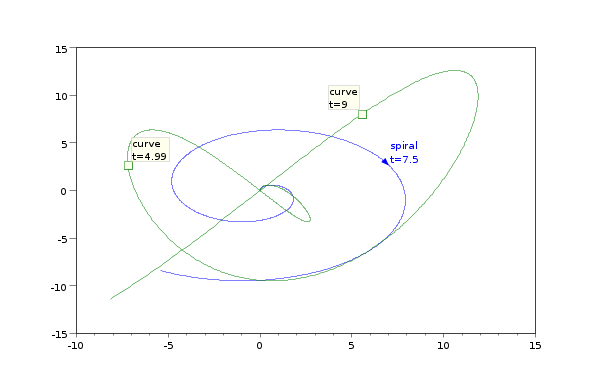
t=linspace(0,10,1000);
clf();
plot(t.*sin(t),t.*cos(t),1.5*t.*sin(t),1.5*t.*cos(1.5*t));
e=gce();
p1=e.children(1);//get the handle on the polyline
p2=e.children(2);//get the handle on the polyline

function str=mytipfmt(curve, pt, index)
  ds=datatipGetStruct(curve)
  if index<>[] then
    t=ds.param(index);
  else //interpolated
    [d,ptp,i,c]=orthProj(curve.data,pt);
    t=ds.param(i)+(ds.param(i+1)-ds.param(i))*c;
  end
  str=msprintf("%s\nt=%-0.3g",ds.name,t);
endfunction

ok=datatipInitStruct(p1,"formatfunction","mytipfmt","param",t,"name","curve");
ok=datatipInitStruct(p2,"formatfunction","mytipfmt","param",t,"name","spiral","style",[2 0]);

datatipCreate(p1,500);
datatipCreate(p1,900);
datatipCreate(p2,750);
| Report an issue | ||
| << datatipGetStruct | Datatips | datatipManagerMode >> |