Scilab-Branch-5.3-GIT
- Aide Scilab
- CACSD
- chart
- abcd
- abinv
- arhnk
- arl2
- arma
- arma2p
- armac
- armax
- armax1
- arsimul
- augment
- balreal
- bilin
- black
- bode
- bstap
- cainv
- calfrq
- canon
- ccontrg
- cls2dls
- colinout
- colregul
- cont_frm
- cont_mat
- contr
- contrss
- copfac
- csim
- ctr_gram
- dbphi
- dcf
- ddp
- des2ss
- des2tf
- dhinf
- dhnorm
- dscr
- dsimul
- dt_ility
- dtsi
- equil
- equil1
- evans
- feedback
- findABCD
- findAC
- findBD
- findBDK
- findR
- findx0BD
- flts
- fourplan
- frep2tf
- freq
- freson
- fspecg
- fstabst
- g_margin
- gainplot
- gamitg
- gcare
- gfare
- gfrancis
- gtild
- h2norm
- h_cl
- h_inf
- h_inf_st
- h_norm
- hallchart
- hankelsv
- hinf
- imrep2ss
- inistate
- invsyslin
- kpure
- krac2
- lcf
- leqr
- lft
- lin
- linf
- linfn
- linmeq
- lqe
- lqg
- lqg2stan
- lqg_ltr
- lqr
- ltitr
- m_circle
- macglov
- markp2ss
- minreal
- minss
- mucomp
- narsimul
- nehari
- nicholschart
- noisegen
- nyquist
- nyquistfrequencybounds
- obs_gram
- obscont
- observer
- obsv_mat
- obsvss
- p_margin
- parrot
- pfss
- phasemag
- ppol
- prbs_a
- projsl
- reglin
- repfreq
- ric_desc
- ricc
- riccati
- routh_t
- rowinout
- rowregul
- rtitr
- sensi
- sgrid
- show_margins
- sident
- sm2des
- sm2ss
- sorder
- specfact
- ss2des
- ss2ss
- ss2tf
- st_ility
- stabil
- svplot
- sysfact
- syssize
- tf2des
- tf2ss
- time_id
- trzeros
- ui_observer
- unobs
- zeropen
- zgrid
Please note that the recommended version of Scilab is 2026.1.0. This page might be outdated.
See the recommended documentation of this function
nicholschart
Nichols chart
Calling Sequence
nicholschart([ modules [,args [,colors]]])
Arguments
- modules
real vector ( modules (in dB))
- args
real vector (phases (in degree))
- colorss
a scalar or a vector, the color indices for isogain and iso phase curves
Description
plot the Nichols'chart: iso-module and iso-argument contours of
y/(1+y) in y phase/gain plane
nicholschart may be used in cunjunction with
black.
The default values for modules and
args are respectively :
[-12 -8 -6 -5 -4 -3 -2 -1.4 -1 -.5 0.25 0.5 0.7 1 1.4 2 2.3 3 4 5 6 8 12]
[-(1:10) , -(20:10:160)]
Examples
//Nichols chart
clf()
nicholschart(modules=[-6 -3 -1 1 3 6], args=[-1 -20 20 40 80 160 180]);

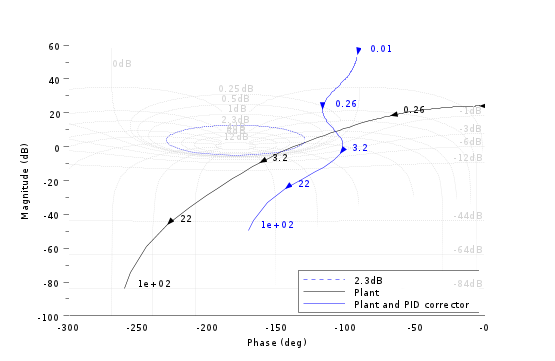
//Black diagram with Nichols chart as a grid
s=poly(0,'s');
Plant=syslin('c',16000/((s+1)*(s+10)*(s+100)));
//two degree of freedom PID
tau=0.2;xsi=1.2;
PID=syslin('c',(1/(2*xsi*tau*s))*(1+2*xsi*tau*s+tau^2*s^2));
clf();
black([Plant;Plant*PID ],0.01,100,["Plant";"Plant and PID corrector"]);
//move the caption in the lower rigth corner
ax=gca();Leg=ax.children(1);
Leg.legend_location="in_lower_right";
nicholschart(colors=color('light gray')*[1 1])
See Also
| << nehari | CACSD | noisegen >> |