kmeans
K-means clustering
Syntax
idx = kmeans(X, k)
[idx, c] = kmeans(X, k)
Arguments
- X
is a nxp (n observations, p variables) real matrix.
- k
a positive integer. It corresponds to number of clusters.
- idx
an integer column vector. It corresponds to clusters indices.
- c
a k x p real matrix containing to cluster centroid locations.
Description
kmeans is an unsupervised learning method for clustering data points. The algorithm iteratively aims to divide the points of X into k clusters, by minimizing the sum of the distances between the data points and the cluster centroid.
kmeans uses the squared Euclidean distance metric.
idx = kmeans(X, k) returns the column vector containing cluster indices of each point.
[idx, c] = kmeans(X, k) returns the k-by-p matrix containing the k cluster centroid locations.
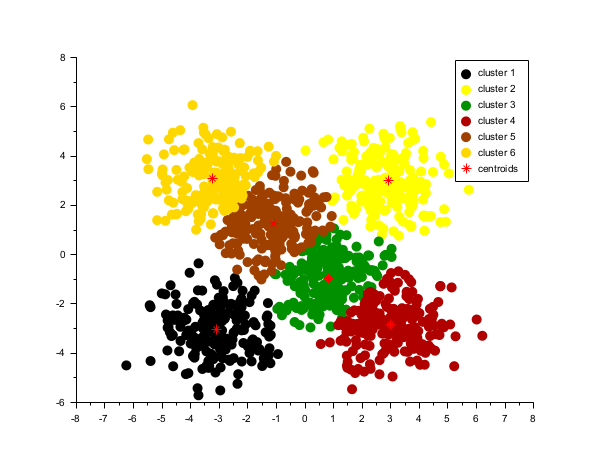
Examples
rand("seed", 0)
n = 200;
x1 = rand(n, 2, "normal") + 3 * ones(n, 2);
x2 = rand(n, 2, "normal") - 3 * ones(n, 2);
x3 = rand(n, 2, "normal") + [3 -3].*.ones(n, 1);
x4 = rand(n, 2, "normal") + [-3 3].*.ones(n, 1);
x5 = rand(n, 2, "normal") + [1 -1].*.ones(n, 1);
x6 = rand(n, 2, "normal") + [-1 1].*.ones(n, 1);
x = [x1; x2; x3; x4; x5; x6];

nbcluster = 6;
[index, c] = kmeans(x, nbcluster);

colors = round(linspace(1, 32, nbcluster));
for i = 1:nbcluster
    mask = index == i;
    cc = colors(i);
    p = plot(x(mask, 1), x(mask, 2), ".", "marksize", 10);
    p.mark_foreground = cc;
    p.mark_background = cc;
end
plot(c(:,1), c(:,2), "*r", "markersize", 10) // centroid of each cluster
gca().box = "off";

l = legend(["cluster " + string(1:6), "centroids"])
l.marks_count =1;
l.line_width = 0.02;
See also
History
| Version | Description |
| 2025.0.0 | Function added. |
| Report an issue | ||
| << estimate_bandwidth | Statistics | meanshift >> |