bar
bar histogram
Syntax
bar(y)
bar(x, y)
bar(x, y, width, colors, style)
bar(x, y [,width] [,colors] [,style])
bar(h, ..)
hdl = bar(...)
Arguments
- h
an axes handle, (default: h=gca() ).
- y
scalar, vector of size N, or matrix N*M of real numbers or encoded integers, with
- N : number of groups (each group of bars gathered on/around an x position)
- M : number of categories in each group
- x
a real scalar or a vector of size N. By default,
- If
yis a vector:x=1:length(y) - If
yis a matrix:x=1:size(y,"r")
- If
- width
(optional), a real scalar, defines the width (a percentage of the available room) for the bar (default: 0.8, i.e 80%).
- colors
(optional) Single string or vector of M strings: colors names (among predefined ones) or "#RRGGBB" hexadecimal codes of categories colors. Default = default plot() colors series, starting with "blue".
- style
a string, 'grouped' (default), or 'stacked'.
- hdl
This optional output contains a handle to a
Compoundobject whose children are the created Polyline objects. Usehdlto modify properties of a specific or all Polyline objects after they are created. For a list of properties, see polyline_properties.
Description
bar(y,...) : if y is a vector, then bar() draws a
polyline which has the polyline_style type 6, versus x=1:length(y).
If y is a matrix N*M, bar() draws M polylines (type 6), versus x=1:size(y,1).
Each polyline represents a category, with a specific color.
 | bar(a, b, ...) where a and b are scalars is interpreted as bar(x, y, ...) (case below) and not as bar(y, width, ...) (this case). |
bar(x,y,...) : if y is a vector, then bar() draws a
polyline which has the polyline_style type 6, where x length
= y length. If y is a matrix NxM then bar function draws M polylines which
have the type 6. Each polyline corresponds to a column of y versus vector
x.
| bar(a, b, ...) where a and b are scalars is interpreted as bar(x, y, ...) (this case) and not as bar(y, width, ...) (case above). |
bar(h,...) : specifies the targeted axes where the drawing is
performed.
bar(...,width,...) : defines the relative width of the bar(s):
0<width<=1.
bar(...,style,...) : defines how the bar is drawn. If y is
a matrix N*M (so M polylines of type 6), then there are two ways to draw
the M bars. the style option = 'grouped' allows to center the M polylines
versus each components of x, and the style option 'stacked' allows to
stack them.
bar(...,colors,...) : defines the colors identifying categories
and filling the corresponding subsets of bars.
If there are several bar() calls, the barhomogenize function
allows to homogenize the width and style of all bars (i.e polylines of
type 6) included in the current working axes.
Examples
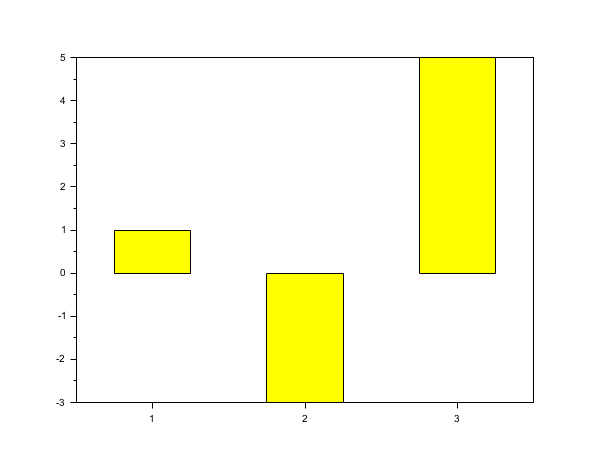
// First example: draw a bar (i.e a polyline with polyline_style type =6) with
// width=0.5 and colors='yellow' and default style='grouped', x=1:length(y).
scf(0);
y=[1 -3 5];
bar(y,0.5,'yellow');
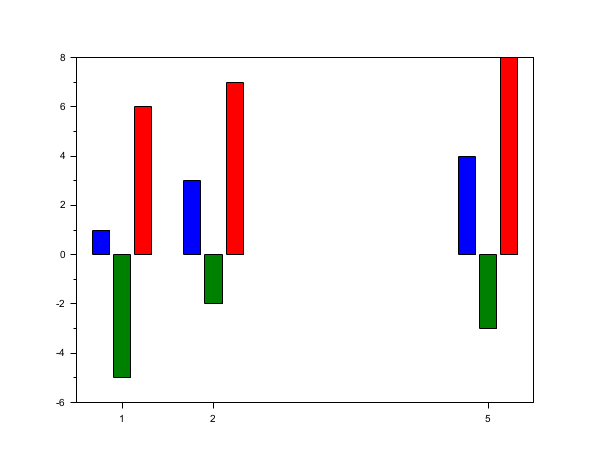
// Second example: draw 3 bars (i.e 3 polylines with polyline_style type =6),default style='grouped'
scf(1);
x=[1 2 5];
y=[1  -5 6;3 -2 7;4  -3 8];
bar(x,y);
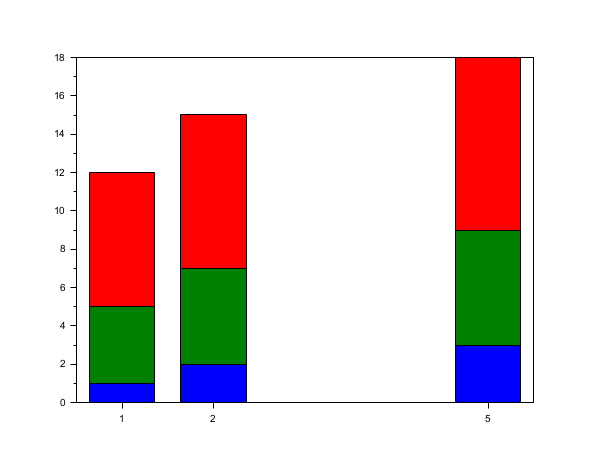
// Third example : style='stacked'.
scf(2);
x=[1 2 5];
y=[1 4 7;2 5 8;3 6  9];
bar(x,y,'stacked');
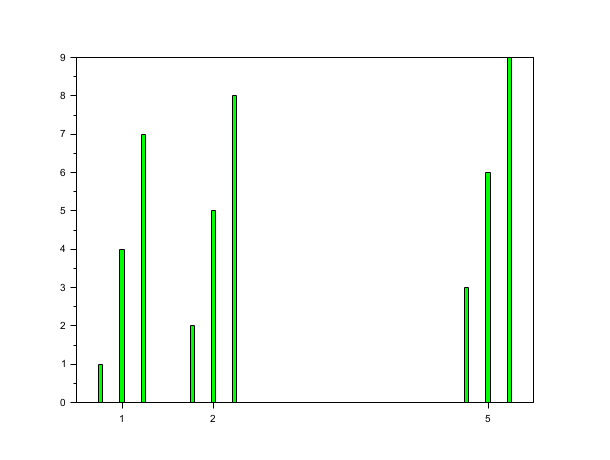
// Fourth example: width=0.2;colors='green'; default style='grouped'
scf(3);
x=[1 2 5];
y=[1 4 7;2 5 8;3 6 9];
bar(x,y,0.2,'green');
See also
- barh — horizontal display of bar histogram
- barhomogenize — homogenize all the bars included in the current working axes
- histplot — plot a histogram
- plot — 2D plot
- named colors — list of named colors
- polyline_properties — description of the Polyline entity properties
- bar3d — 3D гистограмма
History
| Версия | Описание |
| 6.0.1 |
|
| 2025.0.0 |
|
| Report an issue | ||
| << bar_histogram | bar_histogram | barh >> |