Math rendering in Scilab graphics
Display mathematical equations in Scilab graphics through the LaTeX or MathML languages.
Usage
Starting from Scilab 5.2, it is possible to write LaTeX or MathML expression. By default, the processing of strings by one of the two math interpreters (instead of the default text rendering) is triggered by the presence of special characters, but a given interpreter can be forced by setting the corresponding property. To this purpose the Text, Label and Legend entities have the "interpreter" property, the Axis entity has the "tics_interpreters" property and the Axes x_ticks, y_ticks and z_ticks tlists have the "interpreters" field, as summarized in the following table:
| Entity | property name | Reference |
| Text | "interpreter" | text_properties |
| Label | "interpreter" | label_properties |
| Legend | "interpreter" | legend_properties |
| Axis | "tics_interpreters" | axis_properties |
| ticks tlist | "interpreters" | axes_properties |
The allowed value of this property is a scalar string or an array of strings among "auto" (the default), "latex", "mathml" or "none".
When the string to be displayed starts and ends with a "$" (dollar symbol), and if the interpreter is set to "auto", then the LaTeX interpreter is used. If the interpreter is set to "latex", the LaTeX interpreter is used, regardless of the previous rule. It allows to mix regular upright text and math formulas rendered with the same font family. If the interpreter is set to "none", default raw text rendering is used, regardless of the presence of dollar symbols starting and ending the string.
When the string starts with a "<" and ends with ">" with a valid syntax, and if the interpreter is set to "mahtml", then the MathML rendering engine is used. If the interpreter is set to "none", default text rendering is used, regardless of the presence of "<" and ">" starting and ending the string.
When the LaTeX or MathML interpreter fails to render the string because of an invalid syntax, the string is rendered as raw text and in red color. Note that these libraries are dynamically loaded at first use, hence on first use there can be a small lag (note that the MathML interpreter is slower to load than the LaTeX interpreter).
// Example with LaTeX / MathML ticks:
plot2d();
a=gca();

mathml="<mrow>;<mfrac><mrow><mi>d</mi><mi>y</mi></mrow><mrow><mi>d</mi><mi>x</mi></mrow></mfrac><mo>=</mo><mfrac>" + ..
"<mn>1</mn><msup><mi>y</mi><mn>2</mn></msup></mfrac></mrow>";
// LaTeX and MathML mixed expression
a.x_ticks = tlist(["ticks", "locations", "labels"], (0:6)', [mathml;"1";"$\sin(x)$";"3";"$\cos(a) - test$";"5";"6"]);
sleep(1000);
a.x_ticks()
LaTeX description
The rendering engine is based on the Java library JLaTeXMath.
JLaTeXMath is an implementation of the mathematic mode of LaTeX. All LaTeX
base commands are handled (do not hesitate to submit a bug report if
missing). Few TeX commands, like \over are supported.
Since Scilab 5.2.1, greek, cyrillic and complete unicode for latin alphabets characters are handled in the Scilab graphics

title('$\textstyle\sum_{n=1}^{+\infty}\frac1{n^2}=\frac{\pi^2}{6}$')
title('$\big(\bigg)$')
title('$\mbox{Vector field for }\ddot{\theta}=\sin\theta$')
title('$\JLaTeXMath\ \mathfrak{and}\ \mathtt{Scilab}$')
xstring(0.5,0.5,"$\overbrace{привет\ мир} \underbrace{γειά\ κόσμο}$")
JLaTeXMath provides several fonts with the commands
\mathbb, \mathscr,
\mathcal, \mathbf,
\mathit, \mathsf,
\mathtt, \mathfrak,
\mathds, \mathrm, with their bold
versions when they are available with the command
\boldsymbol :
title('$\mathbb{SCILAB}\ \mathsf{or}\ \boldsymbol{\mathfrak{Scilab}}$')
title('$\mathscr{C}\mbox{ n''est pas }\boldsymbol{\mathcal{C}}$')
Different LaTeX packages are available: amsmath, amssymb, stmaryrd, amsxtra and accents with some commands of graphics. Most of the commands of these packages are available (some of amsmath are missing for example).
title('$\sideset{_\alpha^\beta}{_\gamma^\delta}\prod$')
title('$\hat{\accentset{\star}{\hat h}}\undertilde{ABC}$')
title('$\begin{pmatrix}\mathfrak{a}&\alpha\\\mathbb{A}&\mathcal{A}\end{pmatrix}\mbox{ or }' + ...
'\begin{bmatrix}\mathfrak{a}&\alpha\\\mathbb{A}&\mathcal{A}\end{bmatrix}$')
xstring(0.5,0.5,'$\left(\frac{\pi}{\sqrt[3]{2}}\middle|\sqrt{\frac{1+\frac1x}{x}}\right\rangle$')
title('$\doublecup\ddag\fatbslash\lll\oplus\ovee\circledcirc\circlearrowright$')
title('$\rotatebox{180}{\boxed{\JLaTeXMath}}\ \reflectbox{\JLaTeXMath}$')
title('$\scalebox{0.6}{\sum_{n=1}^{+\infty}\frac1{n^2}=\frac{\pi^2}6}$')
title('$\fcolorbox{black}{Tan}{\JLaTeXMath}$')
title('$\textcolor{Magenta}{\mathfrak{Scilab}}\mbox{ and }\textcolor{Green}{\mathcal{SCILAB}}$')
It is also possible to define new commands or new environments:
MathML description
The MathML rendering is based on Jeuclid. Jeuclid is a MathML implementation which covers the whole specification. Therefore, all the MathML language is supported within Scilab.
Due to the size of the Jeuclid library, on the first use, it can take up to a few seconds to load. However, next uses are much faster.

plot3d();
a=get("current_axes");
a.x_label.font_size= 5;
a.x_label.text="<mrow><mfrac><mrow><mn>1</mn></mrow><mrow><mn>2</mn></mrow></mfrac><mo></mo><mfenced open=""{"" close=""}"">" + ..
"<mrow><mfrac><mrow><mfrac><mrow><mi>a</mi></mrow><mrow><mi>b</mi></mrow></mfrac></mrow><mrow><mfrac><mrow>" + ..
"<mi>c</mi></mrow><mrow><mi>d</mi></mrow></mfrac></mrow></mfrac></mrow></mfenced></mrow>"
Using the interpreter property
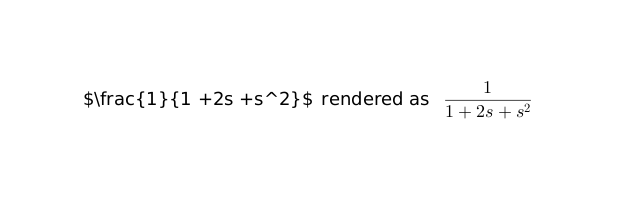
By default (the property is set to "auto") the adequate interpreter (LaTeX of MathML) is triggered by analysing the string to be displayed. However, when a string has to be displayed as is without trying to apply the defaut rules, the property can be set to "none", as in the following LaTeX example:
xstring(0.5,0.5,["$\frac{1}{1 +2s +s^2}$","rendered as","$\frac{1}{1 +2s +s^2}$"])

gce().interpreter(1)="none"
gce().font_size=4
gce().text_box_mode="centered"
Forcing the attribute to "latex" allows to mix regular upright text with math formulas within strings, which otherwise are not detected as valid LaTeX markup:
xstring(0.5,0.5, ["Function is $s\rightarrow \frac{1}{1 +2s +s^2}$"
    "Function is $s\rightarrow \displaystyle\frac{1}{1 +2s +s^2}$"
    "Function is s\rightarrow \frac{1}{1 +2s +s^2}"]);

gce().interpreter(2:3) = "latex"
gce().font_size=4
gce().text_box_mode="centered"
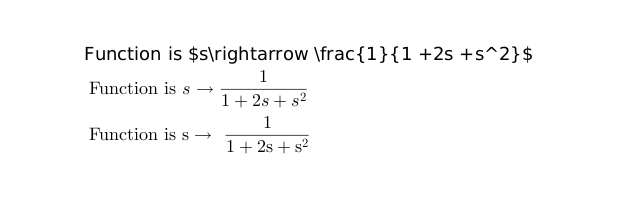
Note in the third string that the absence of dollars does not prevent the rendering but renders math formulas with roman typestyle. This is actually due to the way that mixed text and math formulas are handled by JLaTeXMath, which always renders markup in math mode.
See also
- xtitle — adidciona títulos a janelas de gráficos
- axes_properties — descrição das propriedades de entidades Axes (de eixos)
- label_properties — Descrição de propriedades da entidade Label (rótulo)
- legend_properties — Descrição das propriedades da entidade Legend (legenda)
- text_properties — description of the Text entity properties
- xstringb — escreve strings em uma caixa
- xstringl — computa uma caixa que cerca strings
- xstring — imprime strings
- uicontrol — create a Graphic User Interface object
- uimenu — Create a menu or a submenu in a figure
| Report an issue | ||
| << graphics_fonts | text | stringbox >> |