fsfirlin
design of FIR, linear phase filters, frequency sampling technique
Syntax
[hst]=fsfirlin(hd,flag)
Arguments
- hd
vector of desired frequency response samples
- flag
is equal to 1 or 2, according to the choice of type 1 or type 2 design
- hst
vector giving the approximated continuous response on a dense grid of frequencies
Description
function for the design of FIR, linear phase filters using the frequency sampling technique
Examples
//
//Example of how to use the fsfirlin macro for the design
//of an FIR filter by a frequency sampling technique.
//
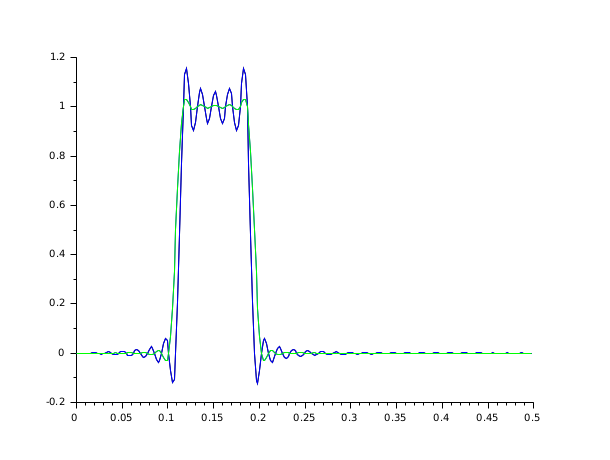
//Two filters are designed : the first (response hst1) with
//abrupt transitions from 0 to 1 between passbands and stop
//bands; the second (response hst2) with one sample in each
//transition band (amplitude 0.5) for smoothing.
//
hd=[zeros(1,15) ones(1,10) zeros(1,39)];//desired samples
hst1=fsfirlin(hd,1);//filter with no sample in the transition
hd(15)=.5;hd(26)=.5;//samples in the transition bands
hst2=fsfirlin(hd,1);//corresponding filter
pas=1/prod(size(hst1))*.5;
fg=0:pas:.5;//normalized frequencies grid
plot2d([1 1].*.fg(1:257)',[hst1' hst2']);

// 2nd example
hd=[0*ones(1,15) ones(1,10) 0*ones(1,39)];//desired samples
hst1=fsfirlin(hd,1);//filter with no sample in the transition
hd(15)=.5;hd(26)=.5;//samples in the transition bands
hst2=fsfirlin(hd,1);//corresponding filter
pas=1/prod(size(hst1))*.5;
fg=0:pas:.5;//normalized frequencies grid
n=prod(size(hst1))
plot(fg(1:n),hst1);
plot2d(fg(1:n)',hst2',[3],"000");

| Report an issue | ||
| << frmag | Filters | group >> |