xpoly
draw a polyline or a polygon
Syntax
xpoly(xv,yv [,dtype [,close]])
h = xpoly(...)
Arguments
- xv,yv
matrices of the same size (points of the polyline).
- dtype
string (drawing style). default value is "lines".
- close
integer. If close=1, the polyline is closed; default value is 0.
- h
This optional output contains a handle to the created Polyline entity. For a list of properties, see polyline_properties.
Description
xpoly draws a single polyline described by the vectors of
coordinates xv and yv. If xv and
yv are matrices they are considered as vectors by
concatenating their columns. dtype can be
"lines" for using the current line style or
"marks" for using the current mark to draw the polyline.
Examples
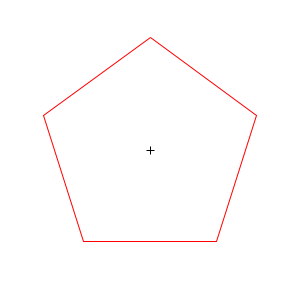
x = sin(2*%pi*(0:4)/5);
y = cos(2*%pi*(0:4)/5);

plot2d(0,0,-1,"010"," ",[-1,-1,1,1])  // draw an empty bounded axes
e = xpoly(x, y)
set(e, "foreground", color("red"), "closed", "on");
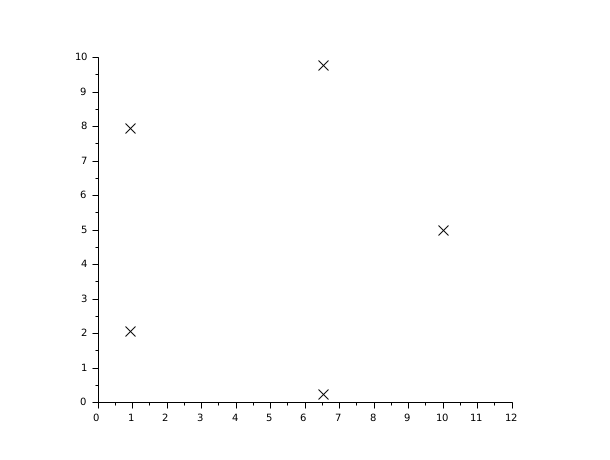
// With marks instead of lines
plot2d(0,0,1,rect=[0,0,12,10], frameflag=3)
t=[0:4]*2*%pi/5;
x=5+5*cos(t);
y=5+5*sin(t);
e = xpoly(x,y,"marks");
set(e,"mark_style",2);
See also
- xfpoly — fill a polygon
- xfpolys — fill a set of polygons
- xpolys — draw a set of polylines or polygons
- polyline_properties — description of the Polyline entity properties
History
| Version | Description |
| 2025.0.0 | Function returns the created handle(s). |
| Report an issue | ||
| << xfpolys | polygon | xpolys >> |