param3d
plots a single curve in a 3D cartesian frame
param3d1
plots a set of curves in a 3D cartesian frame. 1D mesh plot
Syntax
param3d(x, y, z)
param3d(x, y, z, [theta, alpha, leg, flag, ebox])
h = param3d(...)
param3d // demo

param3d1(X, Y, Z)
param3d1(X, Y, list(Z, styles))
param3d1(.., [theta, alpha, leg, flag, ebox])
h = param3d1(...)
param3d1 // demo
Arguments
- x, y, z
3 vectors of the same length: cartesian coordinates of the curve's points.
- X, Y, Z
matrices of the same size (nl,nc). Each column #i of the matrices provides the coordinates of the points for the ith curve.
- styles
vector of nc=size(Z,"c") integers specifying the style -- line color or mark style -- of each curve. When it is specified, it must be bundled with
Zinto a list, usinglist(Z, styles).By default, lines are drawn with colors indexed from 1 to nc in the current color map, without mark.
If
styles(i)<0, the curve #i is plotted only with marks of style #|styles(i)|, without line.Otherwise (
styles(i)>0), the curve #i is rendered as a solid line of color #styles(i), without marks.- theta
Azimuth angle of the (OP) observation point, around the (OZ+) axis, in degrees. Default = 45°.
- alpha
Polar angle of the (OP) observation point to the north pole (Oz+), in degrees, from 0 to 180. Default = 35°.
- leg
single string setting the labels for the 3 axes. "@" is used as a labels separator. Default = "X@Y@Z"
- flag = [type, box]
typeandboxhave the same meaning as inplot3d:- type
Sets the axes scaling and bounding modes. Default = 2.
type gca().isoview data bounds 0 off [0,1, 0,1, -1,1] 1 off in ebox2 off from data points 3 on in ebox4 on from data points 5 on in ebox6 on from data points  Isometrical modes are rendered with
gca().cube_scaling="off".- box
an integer controlling the display of the axes frame (default = 4).
Value Displayed axes Axes legends gca().box gca().axes_visible 0 none. No frame. yes "off" "off" 1 not implemented. Like 0. Please use 0. 2 only axes lines on the back NO "hidden_axes" "off" 3 full ungraduated box yes "on" "off" 4 full box + 3 graduated axes yes "on" "on"
- ebox
Vector
[xmin,xmax, ymin,ymax, zmin,zmax]of axes bounds, used and assigned togca().data_boundswhen theflagoption is used with thetype=1|3|5. By default set to [0,1, 0,1, 0,1].- h
This optional output contains a handle to a Polyline entity or a Compound Entity whose children are the created Polyline objects. Use
hto modify properties of a specific or all Polyline objects after they are created. For a list of properties, see polyline_properties.
Description
param3d() is used to plot a single 3D curve defined by its coordinates
x, y and z.
The curve is an object of polyline type. When it is given the optional output argument
h returns the curves entities,
from which all the curves properties may be changed: color, line style, thickness,
mark style and colors, etc.
h = param3d1() is used to plot a set of 3D curves, all having the
same number of points. When it is given, the optional argument h
returns the Compound of curves entities.
| The handle of curve #i is h.children($-i+1). |
Examples
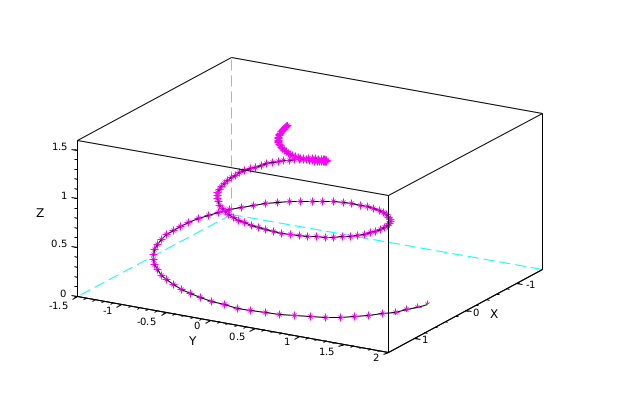
t = 0:0.1:5*%pi;
r = (max(t)-t)/10;

clf
curve = param3d(r.*sin(t), r.*cos(t), t/10, 30, 72,"X@Y@Z",[4,4])

curve.mark_mode = "on";
curve.mark_style = 10;
curve.mark_foreground = color("magenta");
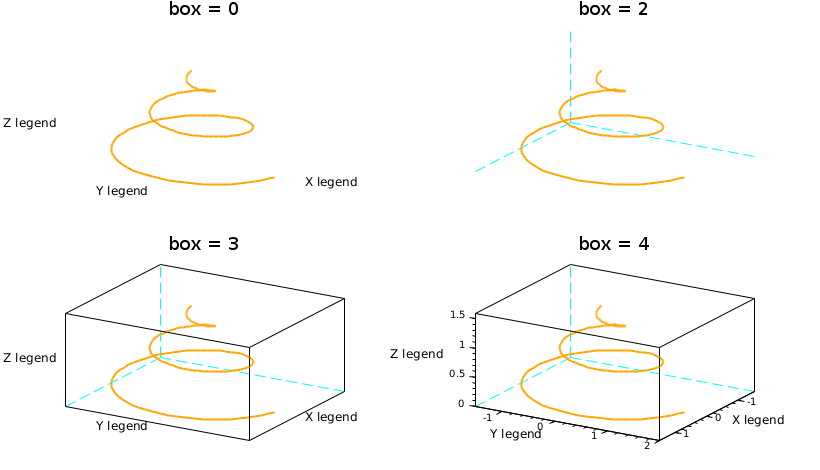
box parameter illustrated with param3d1() used for a single curve :
t = (0:0.1:5*%pi)';
r = (max(t)-t)/10;
x = r.*sin(t); y = r.*cos(t); z = list(t/10, color("orange"));
Box = [0 2 3 4];

clf
for i = 1:4
   subplot(2,2,i)
   param3d1(x, y, z, 31, 72,"X legend@Y legend@Z legend",[4, Box(i)])
   title(msprintf("box = %d",Box(i)), "fontsize", 4)
end
gcf().children.children.thickness = 2; // for the 4 curves in a once
gca().sub_ticks = [4 4 4];             // only for the last axes
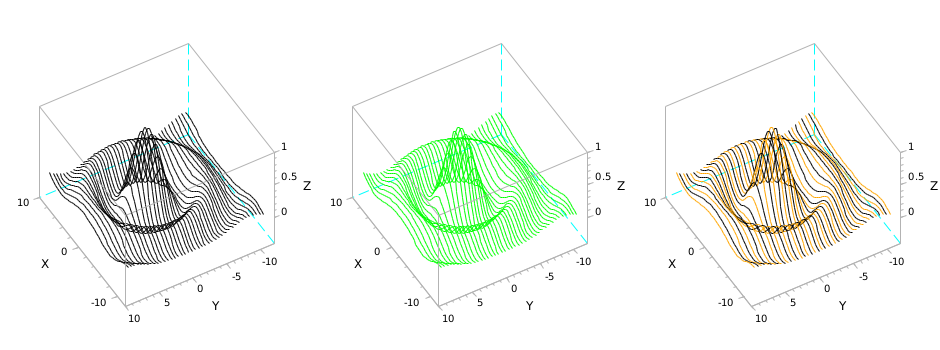
param3d1() used for an actual set of curves:
[X, Y] = ndgrid(-11:0.5:9);
R = sqrt(X.*X + Y.*Y) + %eps;
Z = sin(R)./R;

clf
subplot(1,3,1)
param3d1(X, Y, Z, 150, 85, flag=[2,4])

subplot(1,3,2)
e=param3d1(X, Y, Z, 150, 85, flag=[2,4])
e.foreground = color("green");

subplot(1,3,3)
curves=param3d1(X, Y, Z, 150, 85, flag=[2,4])
curves(1:2:$).foreground = color("orange");
gca().box = "back_half";

gcf().children.foreground = color("grey70"); // box & ticks color for the 3 figures
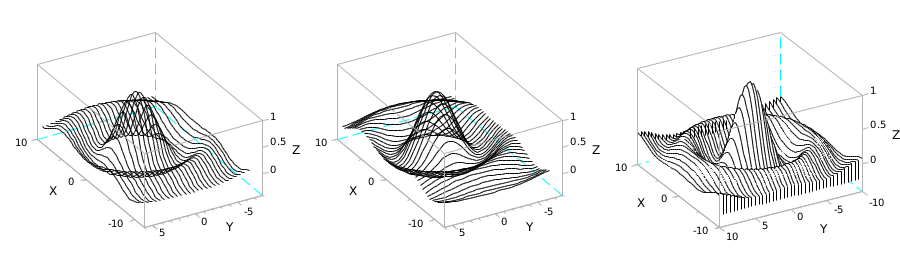
[X, Y] = ndgrid(-11:0.5:9, -7:0.5:6); // x is the long side, y the short one
// => X has constant rows. Y has constant columns

clf

// Meshing lines at constant Y values
subplot(1, 3, 1)
R = sqrt(X.*X + Y.*Y) + %eps;
Z = sin(R)./R;
param3d1(X, Y, Z, 150, 85, flag=[2,4])

// Meshing lines at constant X values, with transposed X and Y:
subplot(1, 3, 2)
R = sqrt(X'.*X' + Y'.*Y') + %eps;
Z = sin(R)./R;
param3d1(X', Y', Z, 150, 85, flag=[2,4])

// With a curtain and filled curves to avoid messed overlaying parts
subplot(1, 3, 3)
[Xo, Yo] = ndgrid(-10:0.5:10);
R = sqrt(Xo.*Xo + Yo.*Yo) + %eps;
Zo = sin(R)./R;
    // we add the curtain on starting and ending sides
nc = size(Xo,"c");
zmin = min(Zo);
X = [Xo(1,:) ; Xo ; Xo($,:)];
Y = [Yo(1,:) ; Yo ; Yo($,:)];
Z = [zmin*ones(1,nc) ; Zo ; zmin*ones(1,nc)];
    // Rendering
e=param3d1(X, Y, Z, 150, 85, flag=[2,4])
e.fill_mode = "on";

// grey box for all axes:
gcf().children.foreground = color("grey70");
See also
- plot3d — 3D plot of a surface
- plot3d3 — mesh plot surface defined by rectangular facets
- scatter 3D — 3D scatter plot
- axes_properties — description of the axes entity properties
- polyline_properties — description of the Polyline entity properties
History
| Version | Description |
| 2025.0.0 | Function returns the created handle(s). |
| Report an issue | ||
| << nf3d | 3d_plot | param3d properties >> |