fftshift
rearranges the fft output, moving the zero frequency to the center of the spectrum
Syntax
y = fftshift(x)
y = fftshift(x, along)
Arguments
- x, y
vectors, matrices or hypermatrices, of same sizes.
- along
1 | "r" | 2 | "c" | 0<along<=ndims(x): dimension along which halves are switched.
Description
If x results of an fft computation, y=fftshift(x)
or y=fftshift(x,"all") moves the zero frequency component to the
center of the spectrum, which is sometimes a more convenient form.
x = [x1  x2 ]    gives   y = [x2  x1 ]  // vector

    [x11 x12]                [x22 x21]
x = |       |    gives   y = |       |  // matrix
    [x21 x22]                [x12 x11]
etc
y=fftshift(x,n) makes the swap only along the nth
dimension.
Examples
x = [1 2 3 4 5 6 7]
fftshift(x)
--> x = [1 2 3 4 5 6 7]
 x  =
   1.   2.   3.   4.   5.   6.   7.

--> fftshift(x)
 ans  =
   5.   6.   7.   1.   2.   3.   4.
x = matrix(1:36,6,6)
fftshift(x)
fftshift(x, "r")
fftshift(x, "c")
--> x = matrix(1:36,6,6)
 x  =
   1.   7.    13.   19.   25.   31.
   2.   8.    14.   20.   26.   32.
   3.   9.    15.   21.   27.   33.
   4.   10.   16.   22.   28.   34.
   5.   11.   17.   23.   29.   35.
   6.   12.   18.   24.   30.   36.

--> fftshift(x)       // Corners go to the center
 ans  =
   22.   28.   34.   4.   10.   16.
   23.   29.   35.   5.   11.   17.
   24.   30.   36.   6.   12.   18.
   19.   25.   31.   1.   7.    13.
   20.   26.   32.   2.   8.    14.
   21.   27.   33.   3.   9.    15.

--> fftshift(x, "r")  // External rows become middle rows
 ans  =
   4.   10.   16.   22.   28.   34.
   5.   11.   17.   23.   29.   35.
   6.   12.   18.   24.   30.   36.
   1.   7.    13.   19.   25.   31.
   2.   8.    14.   20.   26.   32.
   3.   9.    15.   21.   27.   33.

--> fftshift(x, "c")  // External columns become middle columns
 ans  =
   19.   25.   31.   1.   7.    13.
   20.   26.   32.   2.   8.    14.
   21.   27.   33.   3.   9.    15.
   22.   28.   34.   4.   10.   16.
   23.   29.   35.   5.   11.   17.
   24.   30.   36.   6.   12.   18.
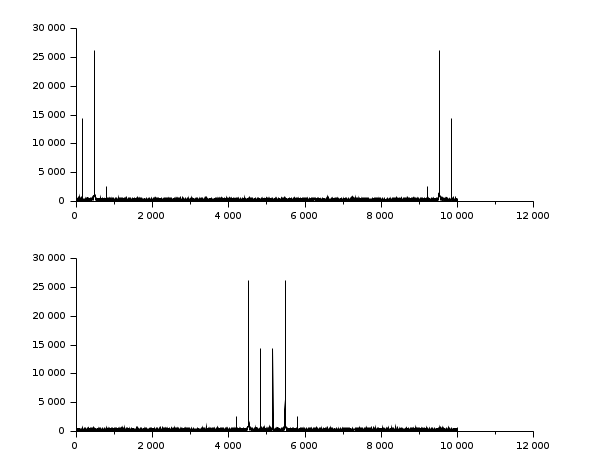
// Make a signal
t = 0:0.1:1000;
x = 3*sin(t)+8*sin(3*t)+0.5*sin(5*t)+3*rand(t);
// Compute the fft
y = fft(x,-1);

// Display
clf();
subplot(2,1,1); plot2d(abs(y))
subplot(2,1,2); plot2d(fftshift(abs(y)))
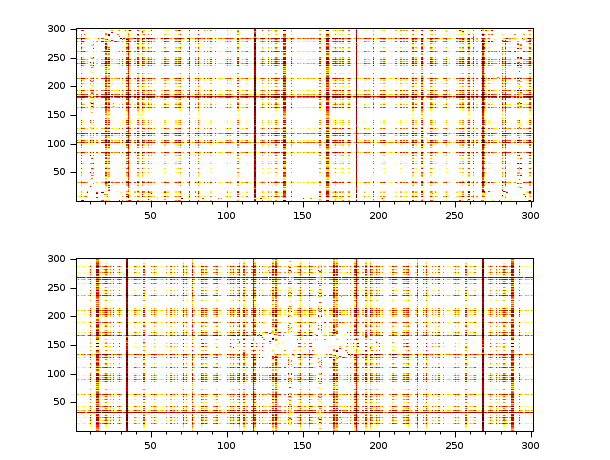
// Make a 2D image
t = 0:0.1:30;
x = 3*sin(t')*cos(2*t)+8*sin(3*t')*sin(5*t)+..
  0.5*sin(5*t')*sin(5*t)+3*rand(t')*rand(t);
// Compute the fft
y = fft(x,-1);

// Display
clf();
gcf().color_map = hot(256);
subplot(2,1,1); Matplot(abs(y))
subplot(2,1,2); Matplot(fftshift(abs(y)))
See also
| Report an issue | ||
| << fft2 | Transforms | hilb >> |