surf
3D surface plot
Syntax
surf()  // sample
surf(Z)
surf(X, Y, Z)
surf(X, Y, fun)
surf(X, Y, list(fun, params))
surf(.., colors)
surf(.., <GlobalProperty>)
surf(.., colors, <GlobalProperty>)
surf(axes_handle,...)
Arguments
- X,Y
two vectors of real numbers, of lengths
nxandny; or two real matrices of sizesnyxnx: They define the data grid (horizontal coordinates of the grid nodes). All grid cells are quadrangular but not necessarily rectangular.By default,
X = 1:size(Z,2)andY = 1:size(Z,1)are used.- Z
a real matrix explicitly defining the heights of nodes, of sizes
nyxnx.- fun
handle of a function, as in
surf(x,y, myFun)where the expected syntax ofmyFunisZ=myFun(X,Y).If the 2D function
funto plot needs some parameters as input arguments, the function and its parameters can be specified through a list, as insurf(x,y, list(delip, -0.4))orsurf(x,y, list(myfun, a,b))withZ = myFun(X,Y, a,b)If
Xor/andYare grid-generating vectors whilefun(…)expects only input matrices,surf(…)automatically generates matrices fromXor/andYand properly callsfun(…).- colors
an optional real matrix defining a colors value for each
(X(j),Y(i))point of the grid (see description below).- <GlobalProperty>
Sequence of couple statements
{PropertyName,PropertyValue}that defines global objects' properties applied to all the curves created by this plot. For a complete view of the available properties (see GlobalProperty).- axes_handle
Handle of the graphical axes where the surface must be drawn. The default axes used is the active
gca()one.
Description
surf draws a colored parametric surface using a grid
whose nodes coordinates are defined by X and Y.
At each node of this grid, a Z coordinate is given using the Z matrix.
surf has been created to better handle Matlab syntax.
To improve graphical compatibility, Matlab users should use
surf rather than plot3d.
Data entry specification :
In this paragraph and to be clearer, we won't mention
GlobalProperty optional arguments as they do not interfere
with entry data (except for "Xdata", "Ydata" and
"Zdata" property, see GlobalProperty). It is
assumed that all those optional arguments could be present too.
X or Y can be :
a) a vector : if
Xis a vector, length(X)=nx. Respectively, ifYis a vector, length(Y)=ny.b) a matrix : in this case, size(
X) (or size(Y)) must equal size(Z).
Color entry specification :
As stated before, the surface is created over a rectangular grid
support. Let consider two independent variables i and
j such as :
a) 1 <= i <= ny  and 1 <= j <= nx
b) i-1,j-1 ---- i-1,j ---- i-1,j+1 ---… |
      |            |          |         | i direction
     i,j-1 -----  i,j -----  i,j+1 ---… |
      |            |          |         |
      :            :          :
                             ............> j direction
This imaginary rectangular grid is used to build the real surface
support onto the XY plane. Indeed,
X,Y and Z data have the same size
(even if X or Y is vector, see below) and can be
considered as 3 functions x(i,j), y(i,j) and
z(i,j) specifying the desired surface. If X or
Y are vectors, they are internally treated to produce good
matrices matching the Z matrix dimension (and the grid is
forcibly a rectangular region).
Considering the 3 functions x(i,j), y(i,j)
and z(i,j), the portion of surface defining between two
consecutive i and j is called a patch.
By default, when no colors matrix is added to a surf call, the colors
parameter is linked to the Z data. When a colors
matrix is given, it can be applied to the patch in two different ways : at
the vertices or at the center of each patch.
That is why, if Z is a [nyxnx]
matrix, the C colors matrix dimension can be
[nyxnx] (one color defined per vertex) or
[ny-1xnx-1] (one color per patch).
Color representation also varies when specifying some GlobalPropery:
The FaceColor property sets the shading mode : it can
be'interp' or 'flat' (default mode). When
'interp' is selected, we perform a bilinear color
interpolation onto the patch. If size(C) equals
size(Z)-1 (i.e. we provided only one color per patch) then
the color of the vertices defining the patch is set to the given color of
the patch.
When 'flat' (default mode) is enabled we use a color
faceted representation (one color per patch). If size(C)
equals size(Z) (i.e. we provided only one color per
vertices), the last row and column of C are ignored.
The GlobalProperty arguments should be used to customize
the surface. Here is a brief description on how it works:
- GlobalProperty
This option may be used to specify how all the surfaces are drawn. It must always be a couple statement constituted of a string defining the
PropertyName, and its associated valuePropertyValue(which can be a string or an integer or... as well depending on the type of thePropertyName). Note that you can set multiple properties : the face & edge color, color data, color data mapping, marker color (foreground and background), the visibility, clipping and thickness of the edges of the surface... (see GlobalProperty )Note that all these properties can be (re-)set through the surface entity properties (see surface_properties).
 | By default, successive surface plots are superposed. To clear the previous
plot, use Enter the command |
Examples
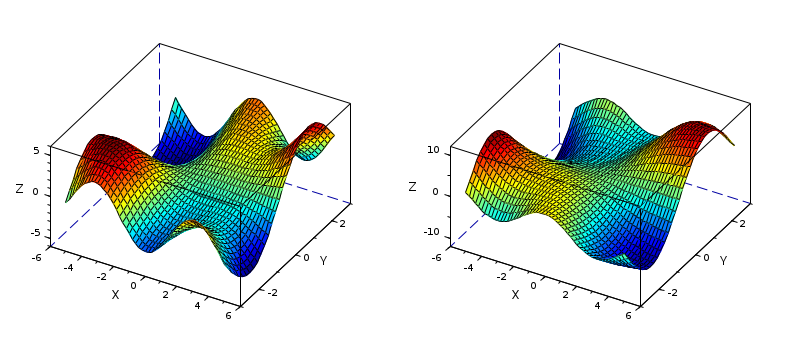
With a function:
function z=mySurf(x, y, a, b)
    if ~isdef("a","l"), a = 1, end
    if ~isdef("b","l"), b = 1, end
    z = a*x.*sin(y) + b*y.*cos(x);
endfunction
clf
subplot(121), surf(-5:0.2:5, -3:0.2:3, mySurf)              // without parameters
subplot(122), surf(-5:0.2:5, -3:0.2:3, list(mySurf, 2,-1))  // with parameters

gcf().color_map = jet(100);
set(gcf(), "axes_size", [800 350], "rotation_style","multiple");
gca().rotation_angles = [40 -60];
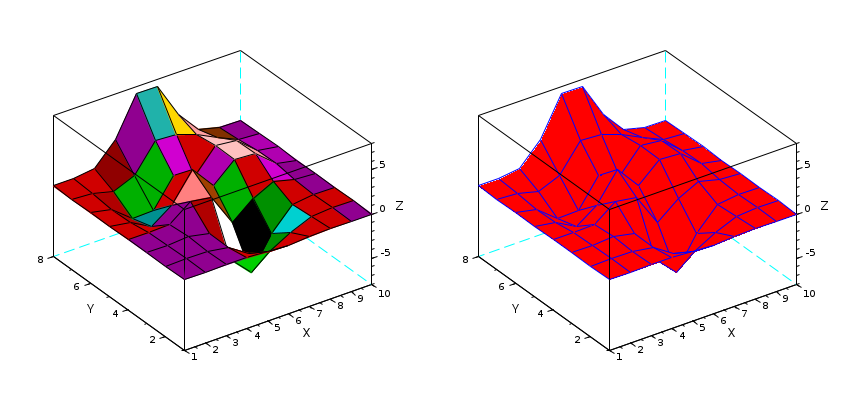
surf(Z):
// Z initialisation

Z= [0.0001    0.0013    0.0053   -0.0299   -0.1809   -0.2465   -0.1100   -0.0168   -0.0008   -0.0000
    0.0005    0.0089    0.0259   -0.3673   -1.8670   -2.4736   -1.0866   -0.1602   -0.0067    0.0000
    0.0004    0.0214    0.1739   -0.3147   -4.0919   -6.4101   -2.7589   -0.2779    0.0131    0.0020
   -0.0088   -0.0871    0.0364    1.8559    1.4995   -2.2171   -0.2729    0.8368    0.2016    0.0130
   -0.0308   -0.4313   -1.7334   -0.1148    3.0731    0.4444    2.6145    2.4410    0.4877    0.0301
   -0.0336   -0.4990   -2.3552   -2.1722    0.8856   -0.0531    2.6416    2.4064    0.4771    0.0294
   -0.0137   -0.1967   -0.8083    0.2289    3.3983    3.1955    2.4338    1.2129    0.2108    0.0125
   -0.0014   -0.0017    0.3189    2.7414    7.1622    7.1361    3.1242    0.6633    0.0674    0.0030];

clf
// simple surface
subplot(121)
surf(Z);  // Note that X and Y are determined by Z dimensions

// same surface with red face color and blue edges
subplot(122)
surf(Z,'facecol','red','edgecol','blu');

gcf().axes_size = [850 400];
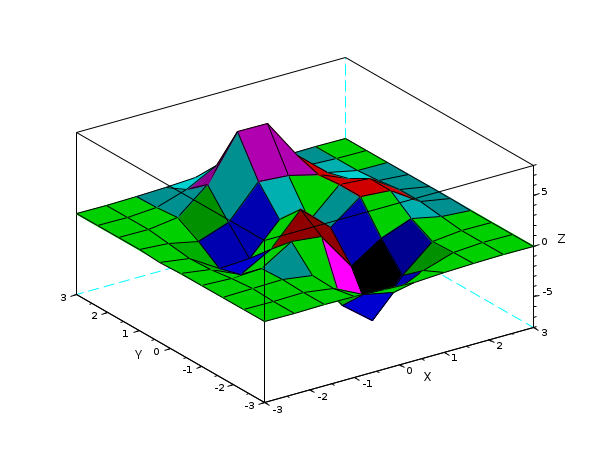
surf(X, Y, Z):
// X and Y initialisation
// NB: here, X has the same lines and Y the same columns
X=[-3.0000   -2.3333   -1.6667   -1.0000   -0.3333    0.3333    1.0000    1.6667    2.3333    3.0000
   -3.0000   -2.3333   -1.6667   -1.0000   -0.3333    0.3333    1.0000    1.6667    2.3333    3.0000
   -3.0000   -2.3333   -1.6667   -1.0000   -0.3333    0.3333    1.0000    1.6667    2.3333    3.0000
   -3.0000   -2.3333   -1.6667   -1.0000   -0.3333    0.3333    1.0000    1.6667    2.3333    3.0000
   -3.0000   -2.3333   -1.6667   -1.0000   -0.3333    0.3333    1.0000    1.6667    2.3333    3.0000
   -3.0000   -2.3333   -1.6667   -1.0000   -0.3333    0.3333    1.0000    1.6667    2.3333    3.0000
   -3.0000   -2.3333   -1.6667   -1.0000   -0.3333    0.3333    1.0000    1.6667    2.3333    3.0000
   -3.0000   -2.3333   -1.6667   -1.0000   -0.3333    0.3333    1.0000    1.6667    2.3333    3.0000
   -3.0000   -2.3333   -1.6667   -1.0000   -0.3333    0.3333    1.0000    1.6667    2.3333    3.0000
   -3.0000   -2.3333   -1.6667   -1.0000   -0.3333    0.3333    1.0000    1.6667    2.3333    3.0000];

Y=[-3.0000   -3.0000   -3.0000   -3.0000   -3.0000   -3.0000   -3.0000   -3.0000   -3.0000   -3.0000
   -2.3333   -2.3333   -2.3333   -2.3333   -2.3333   -2.3333   -2.3333   -2.3333   -2.3333   -2.3333
   -1.6667   -1.6667   -1.6667   -1.6667   -1.6667   -1.6667   -1.6667   -1.6667   -1.6667   -1.6667
   -1.0000   -1.0000   -1.0000   -1.0000   -1.0000   -1.0000   -1.0000   -1.0000   -1.0000   -1.0000
   -0.3333   -0.3333   -0.3333   -0.3333   -0.3333   -0.3333   -0.3333   -0.3333   -0.3333   -0.3333
    0.3333    0.3333    0.3333    0.3333    0.3333    0.3333    0.3333    0.3333    0.3333    0.3333
    1.0000    1.0000    1.0000    1.0000    1.0000    1.0000    1.0000    1.0000    1.0000    1.0000
    1.6667    1.6667    1.6667    1.6667    1.6667    1.6667    1.6667    1.6667    1.6667    1.6667
    2.3333    2.3333    2.3333    2.3333    2.3333    2.3333    2.3333    2.3333    2.3333    2.3333
    3.0000    3.0000    3.0000    3.0000    3.0000    3.0000    3.0000    3.0000    3.0000    3.0000];

Z= [0.0001    0.0013    0.0053   -0.0299   -0.1809   -0.2465   -0.1100   -0.0168   -0.0008   -0.0000
    0.0005    0.0089    0.0259   -0.3673   -1.8670   -2.4736   -1.0866   -0.1602   -0.0067    0.0000
    0.0004    0.0214    0.1739   -0.3147   -4.0919   -6.4101   -2.7589   -0.2779    0.0131    0.0020
   -0.0088   -0.0871    0.0364    1.8559    1.4995   -2.2171   -0.2729    0.8368    0.2016    0.0130
   -0.0308   -0.4313   -1.7334   -0.1148    3.0731    0.4444    2.6145    2.4410    0.4877    0.0301
   -0.0336   -0.4990   -2.3552   -2.1722    0.8856   -0.0531    2.6416    2.4064    0.4771    0.0294
   -0.0137   -0.1967   -0.8083    0.2289    3.3983    3.1955    2.4338    1.2129    0.2108    0.0125
   -0.0014   -0.0017    0.3189    2.7414    7.1622    7.1361    3.1242    0.6633    0.0674    0.0030
    0.0002    0.0104    0.1733    1.0852    2.6741    2.6725    1.1119    0.1973    0.0152    0.0005
    0.0000    0.0012    0.0183    0.1099    0.2684    0.2683    0.1107    0.0190    0.0014    0.0000];

scf(3)
surf(X,Y,Z)
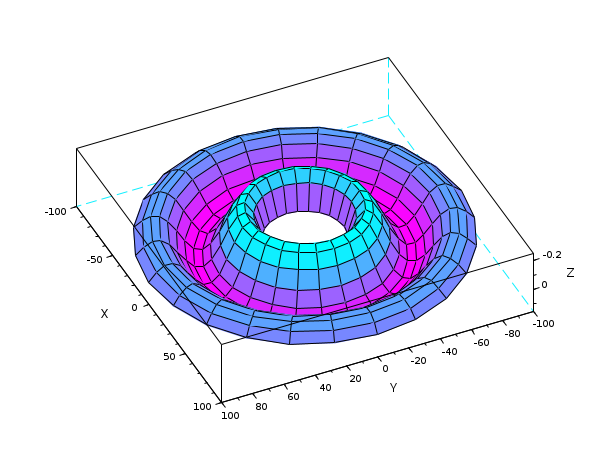
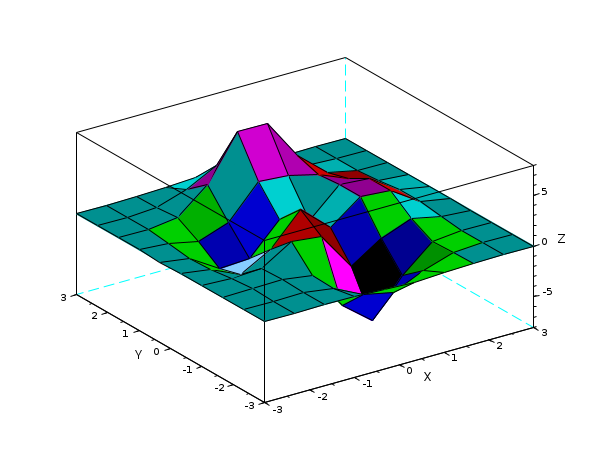
surf(X,Y,Z) on a cylindrical grid.. Facets are still quadrangular:
theta = 0:15:360;
r = 25:5:100;
[R,T] = ndgrid(r,theta);
X = R.*cosd(T);
Y = R.* sind(T);
Z = sinc(R/8);

clf
surf(X, Y, Z)

gcf().color_map = cool(50);
gca().rotation_angles=[195 -155];
// example 3
// X and Y are vectors => same behavior as sample 1
// With vectors, the grid is inevitably rectangular
X = [-3.0000  -2.3333  -1.6667  -1.0000  -0.3333   0.3333   1.0000   1.6667   2.3333   3.0000];
Y = X;
Z =[0.0001    0.0013    0.0053   -0.0299   -0.1809   -0.2465   -0.1100   -0.0168   -0.0008   -0.0000
    0.0005    0.0089    0.0259   -0.3673   -1.8670   -2.4736   -1.0866   -0.1602   -0.0067    0.0000
    0.0004    0.0214    0.1739   -0.3147   -4.0919   -6.4101   -2.7589   -0.2779    0.0131    0.0020
   -0.0088   -0.0871    0.0364    1.8559    1.4995   -2.2171   -0.2729    0.8368    0.2016    0.0130
   -0.0308   -0.4313   -1.7334   -0.1148    3.0731    0.4444    2.6145    2.4410    0.4877    0.0301
   -0.0336   -0.4990   -2.3552   -2.1722    0.8856   -0.0531    2.6416    2.4064    0.4771    0.0294
   -0.0137   -0.1967   -0.8083    0.2289    3.3983    3.1955    2.4338    1.2129    0.2108    0.0125
   -0.0014   -0.0017    0.3189    2.7414    7.1622    7.1361    3.1242    0.6633    0.0674    0.0030
    0.0002    0.0104    0.1733    1.0852    2.6741    2.6725    1.1119    0.1973    0.0152    0.0005
    0.0000    0.0012    0.0183    0.1099    0.2684    0.2683    0.1107    0.0190    0.0014    0.0000];

surf(X,Y,Z)
//LineSpec and GlobalProperty examples:
Z= [   0.0001    0.0013    0.0053   -0.0299   -0.1809   -0.2465   -0.1100   -0.0168   -0.0008   -0.0000
    0.0005    0.0089    0.0259   -0.3673   -1.8670   -2.4736   -1.0866   -0.1602   -0.0067    0.0000
    0.0004    0.0214    0.1739   -0.3147   -4.0919   -6.4101   -2.7589   -0.2779    0.0131    0.0020
   -0.0088   -0.0871    0.0364    1.8559    1.4995   -2.2171   -0.2729    0.8368    0.2016    0.0130
   -0.0308   -0.4313   -1.7334   -0.1148    3.0731    0.4444    2.6145    2.4410    0.4877    0.0301
   -0.0336   -0.4990   -2.3552   -2.1722    0.8856   -0.0531    2.6416    2.4064    0.4771    0.0294
   -0.0137   -0.1967   -0.8083    0.2289    3.3983    3.1955    2.4338    1.2129    0.2108    0.0125
   -0.0014   -0.0017    0.3189    2.7414    7.1622    7.1361    3.1242    0.6633    0.0674    0.0030
    0.0002    0.0104    0.1733    1.0852    2.6741    2.6725    1.1119    0.1973    0.0152    0.0005
    0.0000    0.0012    0.0183    0.1099    0.2684    0.2683    0.1107    0.0190    0.0014    0.0000];

close(winsid()) // destroy all existing figures
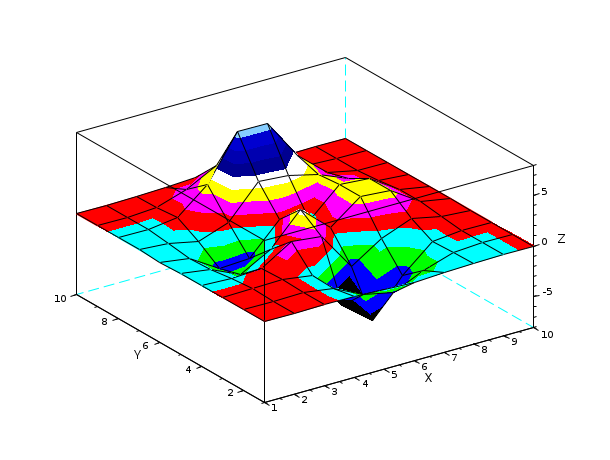
surf(Z,Z+5) // colors array specified
e=gce();
e.cdata_mapping='direct' // default is 'scaled' relative to the colormap
e.color_flag=3; // interpolated shading mode. The default is 4 ('flat' mode) for surf
X = [ -3.0000   -2.3333   -1.6667   -1.0000   -0.3333    0.3333    1.0000    1.6667    2.3333    3.0000
   -3.0000   -2.3333   -1.6667   -1.0000   -0.3333    0.3333    1.0000    1.6667    2.3333    3.0000
   -3.0000   -2.3333   -1.6667   -1.0000   -0.3333    0.3333    1.0000    1.6667    2.3333    3.0000
   -3.0000   -2.3333   -1.6667   -1.0000   -0.3333    0.3333    1.0000    1.6667    2.3333    3.0000
   -3.0000   -2.3333   -1.6667   -1.0000   -0.3333    0.3333    1.0000    1.6667    2.3333    3.0000
   -3.0000   -2.3333   -1.6667   -1.0000   -0.3333    0.3333    1.0000    1.6667    2.3333    3.0000
   -3.0000   -2.3333   -1.6667   -1.0000   -0.3333    0.3333    1.0000    1.6667    2.3333    3.0000
   -3.0000   -2.3333   -1.6667   -1.0000   -0.3333    0.3333    1.0000    1.6667    2.3333    3.0000
   -3.0000   -2.3333   -1.6667   -1.0000   -0.3333    0.3333    1.0000    1.6667    2.3333    3.0000
   -3.0000   -2.3333   -1.6667   -1.0000   -0.3333    0.3333    1.0000    1.6667    2.3333    3.0000];

Y= [   -3.0000   -3.0000   -3.0000   -3.0000   -3.0000   -3.0000   -3.0000   -3.0000   -3.0000   -3.0000
   -2.3333   -2.3333   -2.3333   -2.3333   -2.3333   -2.3333   -2.3333   -2.3333   -2.3333   -2.3333
   -1.6667   -1.6667   -1.6667   -1.6667   -1.6667   -1.6667   -1.6667   -1.6667   -1.6667   -1.6667
   -1.0000   -1.0000   -1.0000   -1.0000   -1.0000   -1.0000   -1.0000   -1.0000   -1.0000   -1.0000
   -0.3333   -0.3333   -0.3333   -0.3333   -0.3333   -0.3333   -0.3333   -0.3333   -0.3333   -0.3333
    0.3333    0.3333    0.3333    0.3333    0.3333    0.3333    0.3333    0.3333    0.3333    0.3333
    1.0000    1.0000    1.0000    1.0000    1.0000    1.0000    1.0000    1.0000    1.0000    1.0000
    1.6667    1.6667    1.6667    1.6667    1.6667    1.6667    1.6667    1.6667    1.6667    1.6667
    2.3333    2.3333    2.3333    2.3333    2.3333    2.3333    2.3333    2.3333    2.3333    2.3333
    3.0000    3.0000    3.0000    3.0000    3.0000    3.0000    3.0000    3.0000    3.0000    3.0000];

Z= [   0.0001    0.0013    0.0053   -0.0299   -0.1809   -0.2465   -0.1100   -0.0168   -0.0008   -0.0000
    0.0005    0.0089    0.0259   -0.3673   -1.8670   -2.4736   -1.0866   -0.1602   -0.0067    0.0000
    0.0004    0.0214    0.1739   -0.3147   -4.0919   -6.4101   -2.7589   -0.2779    0.0131    0.0020
   -0.0088   -0.0871    0.0364    1.8559    1.4995   -2.2171   -0.2729    0.8368    0.2016    0.0130
   -0.0308   -0.4313   -1.7334   -0.1148    3.0731    0.4444    2.6145    2.4410    0.4877    0.0301
   -0.0336   -0.4990   -2.3552   -2.1722    0.8856   -0.0531    2.6416    2.4064    0.4771    0.0294
   -0.0137   -0.1967   -0.8083    0.2289    3.3983    3.1955    2.4338    1.2129    0.2108    0.0125
   -0.0014   -0.0017    0.3189    2.7414    7.1622    7.1361    3.1242    0.6633    0.0674    0.0030
    0.0002    0.0104    0.1733    1.0852    2.6741    2.6725    1.1119    0.1973    0.0152    0.0005
    0.0000    0.0012    0.0183    0.1099    0.2684    0.2683    0.1107    0.0190    0.0014    0.0000];
scf(2)
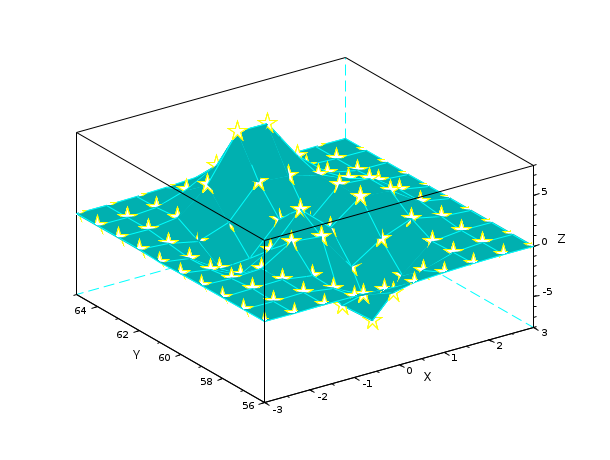
surf(X,Y,Z,'colorda',ones(10,10),'edgeco','cya','marker','penta','markersiz',20,'markeredg','yel','ydata',56:65)
Z= [   0.0001    0.0013    0.0053   -0.0299   -0.1809   -0.2465   -0.1100   -0.0168   -0.0008   -0.0000
    0.0005    0.0089    0.0259   -0.3673   -1.8670   -2.4736   -1.0866   -0.1602   -0.0067    0.0000
    0.0004    0.0214    0.1739   -0.3147   -4.0919   -6.4101   -2.7589   -0.2779    0.0131    0.0020
   -0.0088   -0.0871    0.0364    1.8559    1.4995   -2.2171   -0.2729    0.8368    0.2016    0.0130
   -0.0308   -0.4313   -1.7334   -0.1148    3.0731    0.4444    2.6145    2.4410    0.4877    0.0301
   -0.0336   -0.4990   -2.3552   -2.1722    0.8856   -0.0531    2.6416    2.4064    0.4771    0.0294
   -0.0137   -0.1967   -0.8083    0.2289    3.3983    3.1955    2.4338    1.2129    0.2108    0.0125
   -0.0014   -0.0017    0.3189    2.7414    7.1622    7.1361    3.1242    0.6633    0.0674    0.0030
    0.0002    0.0104    0.1733    1.0852    2.6741    2.6725    1.1119    0.1973    0.0152    0.0005
    0.0000    0.0012    0.0183    0.1099    0.2684    0.2683    0.1107    0.0190    0.0014    0.0000];
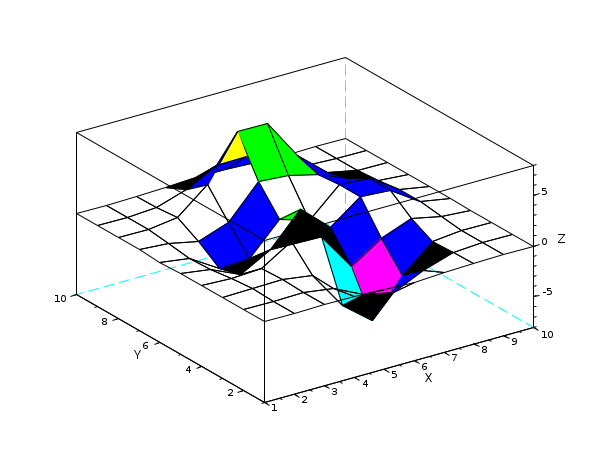
surf(Z,'cdatamapping','direct')
Z= [   0.0001    0.0013    0.0053   -0.0299   -0.1809   -0.2465   -0.1100   -0.0168   -0.0008   -0.0000
    0.0005    0.0089    0.0259   -0.3673   -1.8670   -2.4736   -1.0866   -0.1602   -0.0067    0.0000
    0.0004    0.0214    0.1739   -0.3147   -4.0919   -6.4101   -2.7589   -0.2779    0.0131    0.0020
   -0.0088   -0.0871    0.0364    1.8559    1.4995   -2.2171   -0.2729    0.8368    0.2016    0.0130
   -0.0308   -0.4313   -1.7334   -0.1148    3.0731    0.4444    2.6145    2.4410    0.4877    0.0301
   -0.0336   -0.4990   -2.3552   -2.1722    0.8856   -0.0531    2.6416    2.4064    0.4771    0.0294
   -0.0137   -0.1967   -0.8083    0.2289    3.3983    3.1955    2.4338    1.2129    0.2108    0.0125
   -0.0014   -0.0017    0.3189    2.7414    7.1622    7.1361    3.1242    0.6633    0.0674    0.0030
    0.0002    0.0104    0.1733    1.0852    2.6741    2.6725    1.1119    0.1973    0.0152    0.0005
    0.0000    0.0012    0.0183    0.1099    0.2684    0.2683    0.1107    0.0190    0.0014    0.0000];
surf(Z,'facecol','interp') // interpolated shading mode (color_flag == 3)
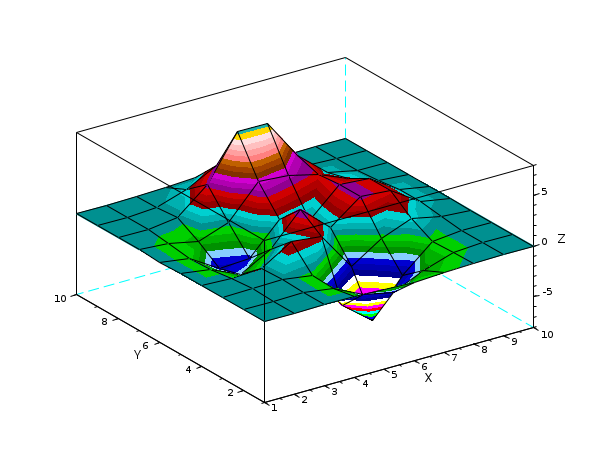
Z= [   0.0001    0.0013    0.0053   -0.0299   -0.1809   -0.2465   -0.1100   -0.0168   -0.0008   -0.0000
    0.0005    0.0089    0.0259   -0.3673   -1.8670   -2.4736   -1.0866   -0.1602   -0.0067    0.0000
    0.0004    0.0214    0.1739   -0.3147   -4.0919   -6.4101   -2.7589   -0.2779    0.0131    0.0020
   -0.0088   -0.0871    0.0364    1.8559    1.4995   -2.2171   -0.2729    0.8368    0.2016    0.0130
   -0.0308   -0.4313   -1.7334   -0.1148    3.0731    0.4444    2.6145    2.4410    0.4877    0.0301
   -0.0336   -0.4990   -2.3552   -2.1722    0.8856   -0.0531    2.6416    2.4064    0.4771    0.0294
   -0.0137   -0.1967   -0.8083    0.2289    3.3983    3.1955    2.4338    1.2129    0.2108    0.0125
   -0.0014   -0.0017    0.3189    2.7414    7.1622    7.1361    3.1242    0.6633    0.0674    0.0030
    0.0002    0.0104    0.1733    1.0852    2.6741    2.6725    1.1119    0.1973    0.0152    0.0005
    0.0000    0.0012    0.0183    0.1099    0.2684    0.2683    0.1107    0.0190    0.0014    0.0000];
scf(10)
axfig10=gca();
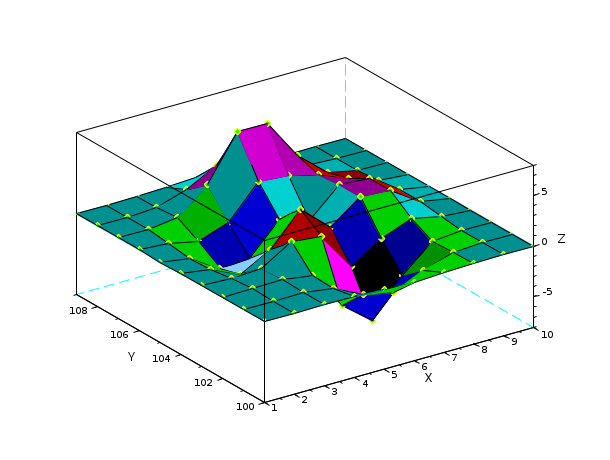
surf(axfig10,Z,'ydat',[100:109],'marker','d','markerfac','green','markeredg','yel') // draw onto the axe of figure 10
See also
- plot2d — 2D plot
- clf — Clears and resets a figure or a frame uicontrol
- close — Closes graphic figures, progression or wait bars, the help browser, xcos, the variables browser or editor.
- delete — delete a graphic entity and its children.
- LineSpec — to quickly customize the lines appearance in a plot
- GlobalProperty — customizes the objects appearance (curves, surfaces...) in a plot or surf command
History
| Version | Description |
| 6.0.2 | The "Foreground", "markForeground", and "markBackground" global properties colors can now be specified as named colors chosen in the full predefined colors list, or by their "#RRGGBB" hexadecimal codes, or by their colormap indices. surf(X,Y,fun..) and surf(X,Y,list(fun, params)) syntaxes added. |
| Report an issue | ||
| << secto3d | 3d_plot | surface properties >> |