isoview
tunes isometric rendering of graphical axes
Syntax
isoview
isoview on
isoview off
isoview(idGraphics)
isoview(idGraphics,"on"|"off")
Arguments
- "on" | "off" | <none>
- Enables or disables or switches the isometric rendering for all considered axes.
- idGraphics
- Vector of graphic handles. All the related axes are processed. By default, the current axes is processed.
Description
isoview is used to set or relax isometric rendering scales
on the x, y (and z) axes, without changing the size of the graphic window.
isoview() or simply isoview
toggles the isoview status of the current axes, and keeps its current
bounds: isometric scales are set whenever
they were free, or scales are relaxed whenever they were isometric.
isoview("on") or isoview on
sets isometric scales for the current axes.
isoview("off") or isoview off
relaxes x, y (and z) scales for the current axes.
isoview(idGraphics,..) runs on axes related
to each graphic object listed in the vector idGraphics:
- If
idGraphics(i)is a figure's handle, all its Axes are considered. - If
idGraphics(i)is an Axes, it is considered as is. - If
idGraphics(i)is the handle of a sub-axes component (such as a polyline, a compound, etc), its hosting axes is considered.
 | The current axes graphical entity is still the same after calling isoview(..). |
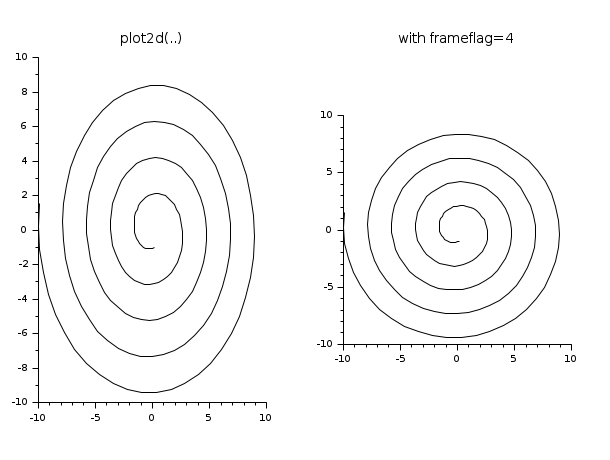
 | To plot some curves directly in isometric mode without calling
isoview afterwards, the plot2d(...,frameflag=4)
option may be used at call time. |
Rendering according to .isoview and .cube_scaling settings
| isoview(..) | gca().isoview | gca().cube_scaling | Rendering |
|---|---|---|---|
| on | on | off | X, Y and Z are isometric |
| off | off | on | independent X, Y and Z scales. In 3D, improved aspect ratios when X/Y/Z ranges are very different. |
| off | off | Independent X, Y, Z scales. In 3D, rendered X/Y/Z scales ratios are close to the data ones | |
| on | on | Scales are such that the axes looks square or cubic |
Examples
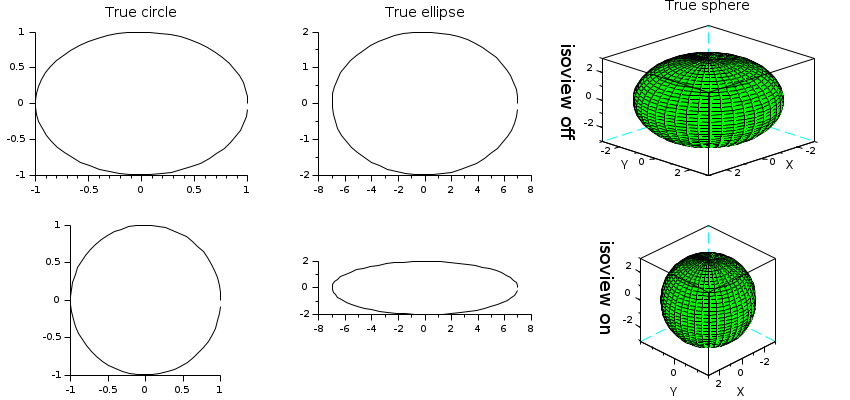
t = [0:0.1:2*%pi]';
clf
nc = 3;

subplot(2,nc,1)
plot2d(cos(t),sin(t))
xtitle("True circle")
a1 = gca();

subplot(2,nc,nc+1)
plot2d(cos(t),sin(t))
isoview

subplot(2,nc,2)
plot2d(7*cos(t),2*sin(t))
xtitle("True ellipse")
a2 = gca();

subplot(2,nc,nc+2)
plot2d(7*cos(t),2*sin(t))
isoview

// plot of a sphere using facets computed by eval3dp
deff("[x,y,z] = sph(alp,tet)",[
    "x = r*cos(alp).*cos(tet)+orig(1)*ones(tet)"; ..
    "y = r*cos(alp).*sin(tet)+orig(2)*ones(tet)"; ..
    "z = r*sin(alp)+orig(3)*ones(tet)"]);
r = 3; orig = [0 0 0];
[xx,yy,zz] = eval3dp(sph,linspace(-%pi/2,%pi/2,40),linspace(0,%pi*2,40));
subplot(2,nc,3)
plot3d(xx, yy, zz, alpha=60, flag=[color("green") 8 4])
zlabel("isoview off", "rotation", -90, "fontsize",4)
xtitle("True sphere")
a3 = gca();
subplot(2,nc,nc+3)
plot3d(xx, yy, zz, alpha=60, flag=[color("green") 8 4])
zlabel("isoview on", "rotation", -90, "fontsize",4)
isoview

// Switching isoview status for all axes
isoview(gcf())

// Forcing isoview for all axes of the current figure
isoview(gcf(), "on")

// Relaxing isoview for the current axes
isoview off

// Setting isoview for top axes
isoview(gcf(),"off")
isoview([a1 a2 a3], "on")

// Using plot2d(..., frameflag=4) :
r = linspace(1,10,200);
t = r*3;
scf();
subplot(1,2,1)
plot2d(r.*sin(t),r.*cos(t))
xtitle("plot2d(..)")

subplot(1,2,2)
plot2d(r.*sin(t),r.*cos(t),frameflag=4)
xtitle("with frameflag=4")

See also
- replot — reframes with new boundaries the current or a given set of axes
- Axes properties — description of the axes entity properties
History
| Version | Description |
| 6.0.0 |
|
| 6.0.2 | "isoview on" now forces .cube_scaling="off", and "isoview off" forces .cube_scaling="on". |
| 6.1 | The syntax isoview(xmin, xmax, ymin, ymax) is no longer available. |
| Report an issue | ||
| << gda | axes_operations | newaxes >> |